


Lysogeny by phi3T prophage alters B. subtilis cell morphology
While exploring the phenotypic consequences of Spbetavirus lysogeny for the B. subtilis host, we observed that integration of the phi3T prophage caused a dramatic change in host cell morphology, from a conventional rod to a more spherical shape (Fig. 1a, b). This phenotype mainly manifested in the stationary growth phase, clearly visible after 16 h of incubation in liquid culture or after 4 h of growth on an agarose pad (Fig. 1d, e).
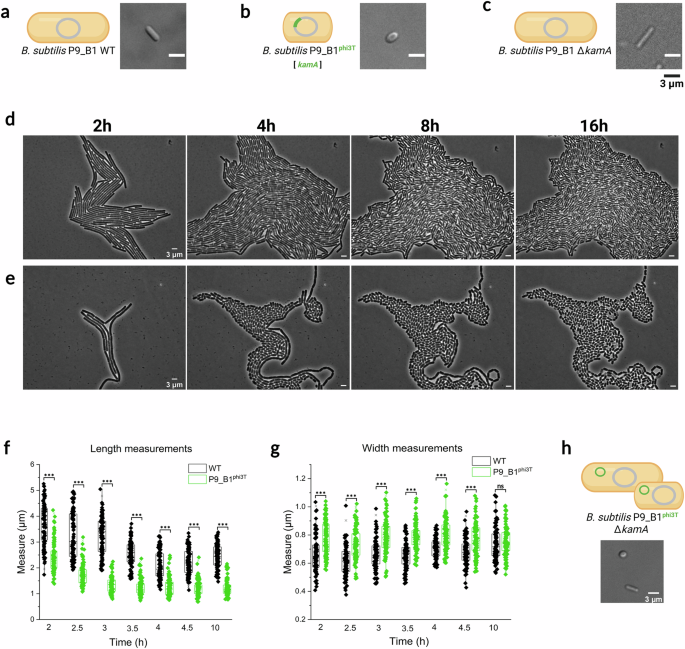
Micrographs and schematic illustrations of (a) B. subtilis P9_B1 WT, bB. subtilis P9_B1phi3T, and c P9_B1 ΔkamA strains after 16 h of incubation. Comparison between phase contrast micrographs of monocultures on agarose pad of (d) B. subtilis P9_B1 WT and (e) P9_B1phi3T in terms of growth and division at the same growth stages (after 2, 4, 8 and 16 h). f Single cell length and (g) width measurements, taken at specific timepoints (from 2 h to 4.5 h of growth, and additionally after 10 h) for both B. subtilis P9_B1 WT and P9_B1phi3T strains. Statistical significance is indicated as follows: ns, not significant (P > 0.05); *P < 0.05; **P < 0.01; ***P < 0.001. h Micrograph depicting cells imaged from B. subtilis P9_B1 ΔkamAphi3T strain after 16 h of incubation. The schematic representations of bacterial cells were created in BioRender. Floccari, V. A. (2025) https://BioRender.com/vv5oklf.
To quantify the differences in cell length and cell width between WT and lysogenic strains, 100 single cells per six selected micrographs were measured using Fiji software from 2 h to 4.5 h of growth, corresponding to early and mid-exponential phases, and additionally after 10 h, corresponding to the stationary phase (Fig. 1f, g). Almost all measurements displayed statistical differences between the two strains (P < 0.001; Fig. 1f, g). As expected, the difference in length increased over time, with lysogenic cells significantly shorter than ancestor cells (Fig. 1f). The two strains also displayed differences in width within the exponential phase, when the lysogenic strain was wider, while the two strains had comparable width in the stationary phase (Fig. 1g).
This phenomenon was observed during lysogenization of the natural soil isolate B. subtilis P9_B1 (CP045811.1)39, hereafter referred to as P9_B1 wild type (WT). This strain is a close relative of B. subtilis 16849. Moreover, the P9_B1 strain, according to our analysis, is not expected to carry any active prophage in its genome (Supplementary Fig. 1). To confirm this, P9_B1 WT and lysogen B. subtilis P9_B1phi3T strains were analyzed for spontaneous (SPI) and MMC-triggered prophage induction (Supplementary Fig. 2a). As expected, no plaques were observed for WT, while the lysogen exhibited prophage induction (SPI, 3×10² PFU mL−1; MMC, 1.9×10⁷ PFU mL−1). Only a single plaque morphology was observed, suggesting that phi3T was the only phage released from P9_B1phi3T (Supplementary Fig. 2a). Both the identity of phi3T and its integration into the host chromosome were confirmed by plaque PCR using specific primers (Supplementary Fig. 2b; see Methods). Afterwards, the entire genome of P9_B1phi3T was sequenced and the integration of the phi3T at the kamA locus was further confirmed (Supplementary Fig. 2c; see Methods), as expected according to previous studies focusing on this temperate phage25.
The prophage phi3T occupies a specific position in the host genome and integrates into the kamA gene19. Although the gene product was identified as L-lysine 2,3-aminomutase, involvement of the encoded protein in bacterial cell physiology and development is still unknown30,31. Therefore, we explored whether there is a link between kamA gene disruption and the unconventional spherical phenotype. Cell morphology of the generated B. subtilis P9_B1 ΔkamA strain was confirmed to be rod-shaped and comparable with WT, excluding the possible involvement of the disrupted kamA gene in acquisition of the new peculiar cell morphology phenotype (Fig. 1c). To further confirm that the integration site does not influence the acquisition of the aberrant spherical phenotype upon phi3T phage infection, the B. subtilis P9_B1 ΔkamA was lysogenized with phi3T prophage. The lysogenization was confirmed by PCR performed on selected lysogen colonies and theirs gDNA (Supplementary Fig. 3a,b; see Methods), and plaque assay (Supplementary Fig. 3c). Interestingly, no difference has been observed in terms of PFU mL−1 values between the two induction methods (SPI, PFU mL−1: 6 ×10⁹; MMC, PFU mL−1: 7 ×10⁹). Moreover, the microscopy imaging showed the presence of two concomitant morphologies: the conventional rod and the aberrant spherical (Fig. 1h).
The newly obtained lysogen was subjected to Nanopore sequencing. Although the analysis proved the presence of phage phi3T, it did not show that is integrated into the host genome. Indeed, the assembly revealed two separate contigs: contig_0001 (4,063,273 bp) and contig_0002 (128,348 bp). The first was a chromosome of B. subtilis P9_B1 ΔkamA and the second was a phage phi3T genome.
Together, these results indicate that lysogeny by phi3T alters B. subtilis cell shape. This effect is likely due to prophage-encoded protein(s) and seems independent of its stable integration into the host chromosome.
Spherical lysogens possess a cell wall and exhibit no change in cell division or ability to sporulate
As the shape of bacterial cells is generally correlated with the composition of the cell wall according to the scientific literature, the presence and integrity of the cell wall was verified by TEM. In fact, it is known that L-form bacteria, including also B. subtilis, can assume an irregular, even spherical morphology due to the complete or partial loss of the cell wall50. Therefore, we questioned whether lysogens for the phi3T prophage still have a cell wall, comparable to WT. TEM micrographs of cellular cross-sections showed no evident difference between the cell wall of B. subtilis P9_B1 WT (Fig. 2a) and the lysogenic strain (Fig. 2b).
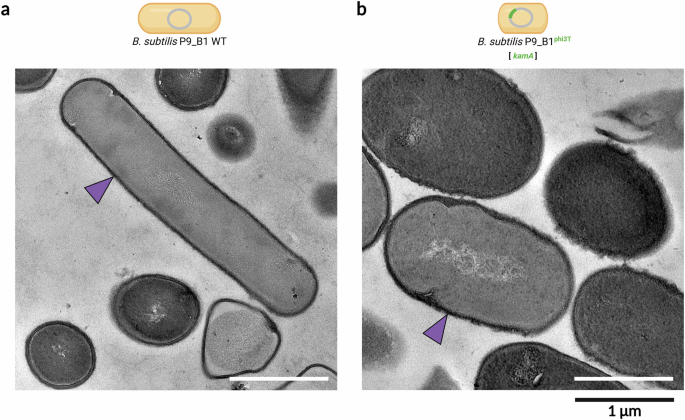
TEM micrographs depicting sections of vegetative cells of (a) B. subtilis P9_B1 WT and (b) P9_B1phi3T. Purple arrows show the presence of the cell wall in both strains. The schematic representations of bacterial cells were created in BioRender. Floccari, V. A. (2025) https://BioRender.com/b8qfrr1.
In order to understand the phenomenon underlying the altered cell morphology, the mechanism of cell division was analyzed. We hypothesized that lysogenic cells might divide asymmetrically at certain growth stages. First, a time-lapse experiment was performed in which the growth and division of B. subtilis P9_B1 WT and P9_B1phi3T was monitored for 16 h (Movie S1 and S2). In contrast to WT cells that maintained the conventional rod shape throughout the experiment (Movie S1), the aberrant spherical phenotype was more pronounced in lysogenic cells after 4 h (in the mid-exponential phase) and was maintained until the stationary phase (Movie S2). Cells of P9_B1phi3T continued to divide even after they started to deviate from rod-shaped morphology. After ~14 h, already in the late stationary phase, some cells of both strains started to lyse, probably due to lack of nutrients and/or limited oxygen (Movie S1 and S2).
The cell membrane intercalating the fluorescent FM4-64 dye was used to localize the position of the division septum. Interestingly, lysogenic cells maintained symmetric division of the mother cell into the two daughter cells, as the septum always localized in the center of the cell (Fig. 3a), as observed for WT cells. This indicates no difference in positioning the septum in the aberrant spherical cells.
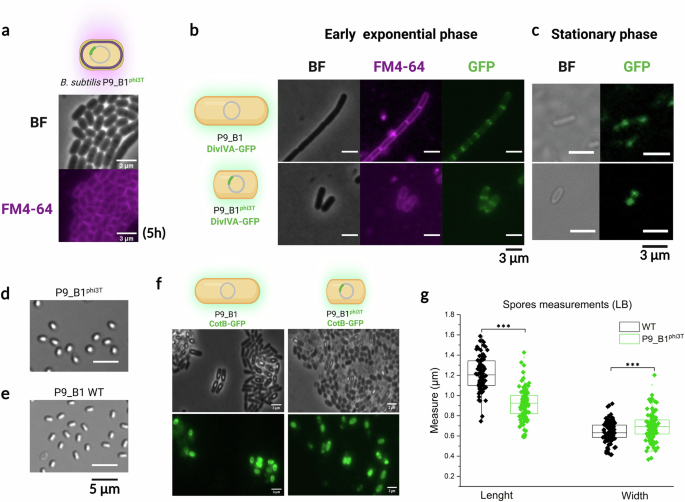
a Snapshot from time-lapse experiments on B. subtilis P9_B1phi3T, showing growing cells stained with FM4-64 after incubation for 5 h. Division septa are visible at mid-cell. b Snapshots from time-lapse experiments tracking the distribution of DivIVA-GFP protein in B. subtilis P9_B1 DivIVA-GFP and P9_B1phi3T DivIVA-GFP in the early exponential phase. In both strains, the reporter fusion construct is localized in the center of dividing cells. c Single cells imaged after 24 h of incubation, showing DivIVA-GFP protein distribution at the poles in the stationary phase. Micrographs of spores of (d) B. subtilis P9_B1phi3T and (e) P9_B1 WT, showing that the lysogenic strain exhibits a peculiar morphology also in the spore state. f Snapshots from time-lapse experiments showing comparable CotB-GFP protein expression in the two strains. g Length and width measurements of B. subtilis P9_B1 WT and P9_B1phi3T spores obtained by growing both strains in LB medium. The statistical significance is indicated as follows: ns, not significant (P > 0.05); *P < 0.05; **P < 0.01; ***P < 0.001. The schematic representations of bacterial cells were created in BioRender. Floccari, V. A. (2025) https://BioRender.com/jcfihl3.
Next, we investigated the distribution of the DivIVA protein, a well characterized curvature-sensing protein that acts as a polar scaffold during division and division-site placement. During the exponential phase, DivIVA is flanking the septum at mid-cell, while it is retained at the poles during the stationary phase51. Time-lapse experiments with DivIVA-GFP producing B. subtilis P9_B1 WT and its phi3T lysogenic version revealed that the DivIVA protein was distributed similarly in the two strains (Fig. 3b). Independently, the correct DivIVA distribution during the stationary phase was also confirmed in single cells grown for 24 h (Fig. 3c).
Thus, the irregular cell shape already manifests in the mid-exponential phase, and it is not likely to be caused by lack of a cell wall, changes in cell division mechanism, or aberrant septum placement.
We also wondered whether the elongation mechanism could be responsible for the acquisition of the spherical shape. In particular, we investigated the possibly different distribution of the actin-like MreB protein, known to play an important role in the determination and maintenance of cell rod shape in bacteria52,53. Since MreB is responsible for the localization of the replication machinery, its depletion leads to the loss of the rod phenotype54. First, a phenotypic effect of MreB loss was confirmed, as a more spherical morphology was observed in both P9_B1 ∆mreB and P9_B1phi3T ∆mreB (Supplementary Fig. 4a). Next, the two strains B. subtilis P9_B1 and P9_B1phi3T were constructed, both carrying the MreB-GFP protein fusion, and subjected to TIRF imaging at four time points (0 – 2 h – 4 h – 24 h). While P9_B1phi3T MreB-GFP showed constantly a lower fluorescence compared to the WT, no differences have been observed between the two strains in terms of distribution pattern of MreB protein (Supplementary Fig. 4b). Whether the lower fluorescence is related to a lower MreB concentration requires further investigation.
As the lysogenic cells displayed no obvious changes in cell division or elongation regarding MreB, we analyzed their ability to sporulate and germinate (see Methods). Sporulation assays in combination with microscopy analysis clearly indicated the presence of spores (Fig. 3d, e). Specifically, image analysis revealed that >80% of cells sporulated in both strains after 48 h (Supplementary Fig. 5a). Interestingly, spores of P9_B1phi3T showed a shorter and more spherical morphology compared to WT spores (Fig. 3d, e). Moreover, CFU assays confirmed that spores of the lysogen remained viable, as they were able to germinate and form colonies on solid agar medium after heat treatment (Supplementary Fig. 5b; see Methods). Despite the altered spore shape, TEM analysis showed no differences in spore sections. Indeed, spores of both strains exhibited the same amount and distribution of spore layers, consisting of a crust, outer and inner coat, core, and cortex (Supplementary Fig. 5c).
In further support of these results, both strains showed in average similar expression of spore coat protein CotB (Fig. 3f). Interestingly, the fluorescence intensity of the CotB-GFP fusion protein measured at the single cell level displayed more variation among spores of the lysogenic strain, but overall no significant differences between the two strains were detected (P > 0.05; Supplementary Fig. 5d). To further confirm that the P9_B1phi3T spores have a different morphology than the P9_B1 WT ones, spores of both strains were grown in three different media (NSM, LB and MSgg) and 100 spores were measured for length and width after imaging. In all three media tested, P9_B1phi3T spores were always shorter than the WT spores (P < 0.001). However, the difference in spore width was media dependent, as spores of the lysogen were significantly wider compared to WT spores in LB medium only (P < 0.001). (Fig. 3g, Supplementary Fig. 5e).
Lysogeny by phi3T impairs host competitive fitness
Next, the effect of phi3T prophage lysogeny was explored on host fitness. In the presence of the phi3T prophage, a peculiar growth curve was observed, exhibiting differences already in the early exponential phase (Fig. 4a). Overall, the maximum optical density (ODmax) was significantly higher for WT cells (Supplementary Fig. 6a). Interestingly, the lysogen exhibited a slightly faster growth rate and doubling time than WT in the early exponential phase (Supplementary Fig. 7a; Supplementary Fig. 6b), but this difference in growth rate was dramatically reverted in the late exponential phase (Supplementary Fig. 7a; Supplementary Fig. 6c), when the lysogen displayed much slower growth than WT. In line with OD measurements, the phi3T lysogen also showed lower CFU values at initial stages of growth (Fig. 4b). A lysogen for SPβ prophage (P9_B1SPβ, DTUB231), a close relative of phi3T phage, was used as an additional control. The significantly lower P9_B1phi3T CFU ml−1 relative to the WT and SPβ lysogen were observed after 8 h, a timepoint which coincided with the acquisition of spherical morphology by the lysogen (Fig. 4a–c).
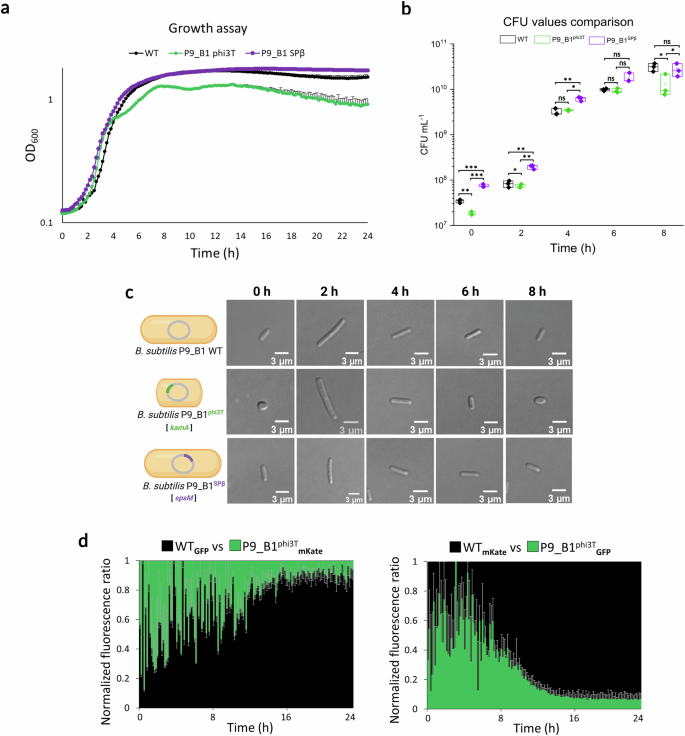
a Growth assay results showing differences in growth dynamics among B. subtilis P9_B1 WT (in black), P9_B1phi3T (in green) and P9_B1SPβ (in purple). Only top error bars are shown for each growth curve. b Comparison of CFU mL−1 values at five time points (0 – 2 h – 4 h – 6 h – 8 h) between the three strains analyzed. The statistical significance is indicated as follows: ns, not significant (P > 0.05); *P < 0.05; **P < 0.01; ***P < 0.001. c Micrographs showing the single cells from the three strains sampled at the five time points mentioned above. It can be clearly seen how the morphology of P9_B1phi3T changes according to the growth stage, while both WT and P9_B1SPβ retain rod cell morphology and differ only in cell length. d Competition assay results in liquid medium. The antagonistic strains were labeled in co-cultures with two different fluorescent proteins (GFP and mKate) and tested in both combinations of fluorescent markers. The schematic representations of bacterial cells were created in BioRender. Floccari, V. A. (2025) https://BioRender.com/xaugkj0.
Next, we labeled the strains with constitutive fluorescent reporters (GFP and mKate) and performed a competition assay between P9_B1 WT and P9_B1phi3T in liquid medium, starting from a 1:1 mixed co-culture. The experiments were repeated with the fluorescent reporter swapped. Regardless of the fluorescent marker used, the lysogen for phi3T was consistently at a disadvantage (Fig. 4d; Supplementary Fig. 8). As an additional control, we also included an experiment with the P9_B1SPβ strain, which as expected according to previous results14, showed a positive effect on host fitness (Supplementary Fig. 9). Overall, the altered cell shape of P9_B1phi3T was accompanied by a lower growth rate, lower maximum yield, and impaired competitive fitness.
Lysogeny by phi3T increases susceptibility to cell wall-targeting antimicrobials
Possible differences in cell wall between the P9_B1 WT strain and the phi3T lysogen were further investigated by testing their susceptibility to cell wall-targeting antibiotics. In particular, two antimicrobial agents were selected that inhibit different cell wall synthesis steps, namely ampicillin (Amp) and D-cycloserine (DCS). Indeed, while ampicillin exerts its inhibition effect in the final steps55,56 of the cell wall synthesis, D-cycloserine57 has an effect in the early stages.
For possible differences in antimicrobial susceptibility, the minimum inhibitory concentration (MIC) was determined and compared.
In all experiments performed, the WT strain always had a higher MIC (Amp, 150 μg mL−1; DCS, 250 μg mL−1) than the P9_B1phi3T strain (Amp, 12 μg mL−1; DCS, 150 μg mL−1; Fig. 5a–c; Supplementary Fig. 10a, b). Additionally, we tested the ampicillin response of P9_B1 DL in comparison with P9_B1 WT, where both strains exhibited the same MIC result (Supplementary Fig. 11). To further connect the lower MIC to potential differences in the host cell wall, we tested the antibiotic spectinomycin (Spec), which has a cytosolic target not related to the cell wall. Interestingly, both WT and phi3T lysogen exhibited similar MICs (50 μg mL−1; Fig. 5c; Supplementary Fig. 12).
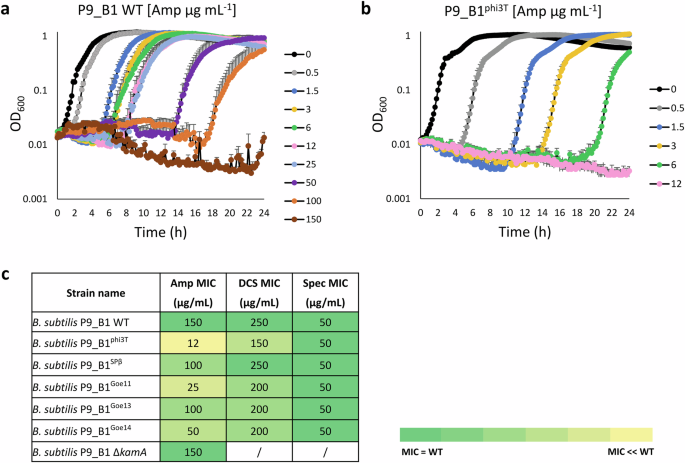
aB. subtilis P9_B1 WT and bB. subtilis P9_B1phi3T were tested for susceptibility to ampicillin (Amp). For each growth curve, only the top error bars are shown. c Table summarizing the results obtained from the antimicrobial susceptibility test, showing MIC values observed for each strain tested, depending on the specific antimicrobial ampicillin (Amp), D-cycloserine (DCS) and spectinomycin (Spec). Differences in susceptibility for each strain are represented as a color code from the darkest (identical to WT) to the brightest (extremely different to the WT).
Moreover, the hypothesis that the lower MIC registered for phi3T lysogen compared to WT might be linked to possible prophage induction was rejected by the plaque assay result. In fact, the PFU mL−1 value at the MIC of any of the antibiotics tested was not significantly higher than the control (0 μg mL−1) (Supplementary Fig. 13).
Additional SPbeta-like viruses also alter host susceptibility to cell wall-targeting antimicrobials
Next, we investigated whether other phages of the genus Spbetavirus could trigger similar changes in cell shape or antibiotic susceptibility during lysogeny of B. subtilis P9_B1. The bacterial model strain P9_B1 was lysogenized with three more SPbeta-like viruses, each integrated in a specific integration site in the host chromosome: Goe11 (kamA), Goe13 (spsM), and Goe14 (spoVK). The obtained lysogens, including P9_B1SPβ (with SPβ integrated into spsM gene), were confirmed by PCR and checked for potential morphology changes using single-cell microscopy imaging (Fig. 6a).
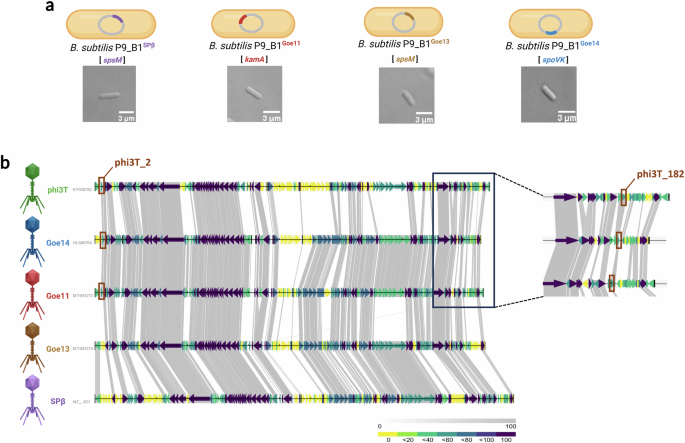
a From left to right, micrographs of single cells taken after 16 h of incubation for strains B. subtilis P9_B1SPβ, P9_B1Goe11, P9_B1Goe13, and P9_B1Goe14 which show a rod-shaped cell morphology. b Genome comparison among all SPbeta-like viruses used in this study, in order from the top to the bottom: phi3T (128 kbp), Goe14 (125 kbp), Goe11 (126 kbp), Goe13 (126 kbp) and SPβ (136 kbp).The genes shared exclusively by phi3T, Goe11, and Goe14 (phi3T_2 and phi3T_182), which may be linked to reduced host ampicillin resistance in the respective B. subtilis P9_B1 lysogens compared to the WT strain, are highlighted in brown. The schematic representations of bacterial cells and phage particles were created in BioRender. Floccari, V. A. (2025) https://BioRender.com/vuvl0h0.
Interestingly, the other lysogens showed a conventional rod-shaped morphology (Fig. 6a). Notably, even though phage Goe11 integrates in the same attB site as phi3T, it does not lead to any change in host morphology, which further confirms that disruption of the kamA gene is not responsible for the aberrant phenotype. Subsequently, all new lysogenic strains were screened for spontaneous (SPI) and MMC-triggered prophage induction. While phage SPβ always displayed the lowest titer (SPI, 2×10² PFU mL−1; MMC, 6×10⁵ PFU mL−1), increasing only after MMC induction, phage Goe13 always exhibited the highest titer (SPI, 3×10² PFU mL−1; MMC, 1.3×10¹¹ PFU mL−1), followed by Goe11 (SPI, 6×10² PFU mL−1; MMC, 2.4×10⁸ PFU mL−1) and Goe14 (SPI, 2×10² PFU mL−1; MMC, 1×10⁶ PFU mL−1; Supplementary Fig. 14a). Thus, no correlation was observed between the high rate of SPI or MMC-triggered prophage induction and the effect on host cell morphology. Additionally, single plaque morphology varied slightly for each tested lysogen (Supplementary Fig. 14b). While P9_B1Goe14 had a slightly shorter lag phase than other lysogens, no dramatic differences in growth dynamics of lysogens were observed compared with WT (Supplementary Fig. 15a,b,c and d).
Next, we compared the responses of other lysogens to cell wall-targeting antibiotics and to spectinomycin. For ampicillin and D-cycloserine, a lower MIC compared to WT was also observed for most of the other lysogens tested, namely P9_B1SPβ (Amp, 100 μg mL−1; DCS, 250 μg mL−1), P9_B1Goe11 (Amp, 25 μg mL−1; DCS, 200 μg mL−1), P9_B1Goe13 (Amp, 100 μg mL−1; DCS, 200 μg mL−1), and P9_B1Goe14 (Amp, 50 μg mL−1; DCS, 200 μg mL−1; Fig. 5c; Supplementary Fig. 10a,b), while MIC measured for phi3T lysogen was still the lowest. Interestingly, the lowest MIC values were registered only with ampicillin for P9_B1phi3T, P9_B1Goe11, and P9_B1Goe14, two of which possess the kamA gene as the attB site for the prophage. Since the function of kamA has not been described, we explored its possible involvement in the acquisition of a lower MIC by testing the P9_B1 ΔkamA strain. The MIC (150 μg mL−1) obtained for the ΔkamA strain was identical to that of WT (Fig. 5c; Supplementary Fig. 10a). Similar to the phi3T lysogen, other lysogens did not differ from WT in their susceptibility to spectinomycin (Supplementary Fig. 12). They also did not show an increase in SPI upon exposure to antibiotics (Supplementary Fig. 13).
Finally, we used Synphage software48 to search for proteins and genes that were shared solely between phi3T, Goe14, and Goe11, that showed the greatest decrease in MIC for cell wall-targeting antibiotics (Fig. 6b). Two genes common to phi3T, Goe14 and Goe11, but absent in SPβ and Goe13 were found: phi3T_2, encoding a putative acetyltransferase, and phi3T_182, encoding a hypothetical protein (Supplementary Table 1). Notably, presence of the O-acetyltransferase was reported to cause an extensive reduction in penicillin resistance in Streptococcus pneumoniae58. This suggest that these prophages may encode a protein/component capable of modifying the peptidoglycan of their host, making it more vulnerable to β-lactam and/or other antimicrobials targeting the cell wall. Further experiments are needed to confirm the presence and expression of a similar protein in the abovementioned lysogens.
The Synphage software was additionally used to identify unique features in phi3T phage, revealing a total of 63 genes and 44 proteins (Supplementary Table 2). We hypothesize that the component responsible for the morphological change by phi3T is present within this non-conserved part of the genome.
The effect of phi3T on cell shape is host-specific
While phi3T lysogeny has been explored previously by other researchers30,31, no change in cell shape was reported. Therefore, we further investigated if the observed spherical phenotype of the P9_B1 lysogen is host strain-specific. We lysogenized a set of different B. subtilis hosts, including 168, 3610, ∆6, and PY79, followed by examination of host morphology. Cell morphology became more spherical in B. subtilis Δ6phi3T, but the classic rod shape morphology was preserved in 168phi3T, 3610phi3T, and PY79phi3T strains (Fig. 7a). While B. subtilis 168 and 3610 strains carry the SPβ prophage in their genome and their “resistance” to phi3T-mediated cell shape change could be due to phage-phage interaction, the PY79 strain is not lysogenic for SPβ.
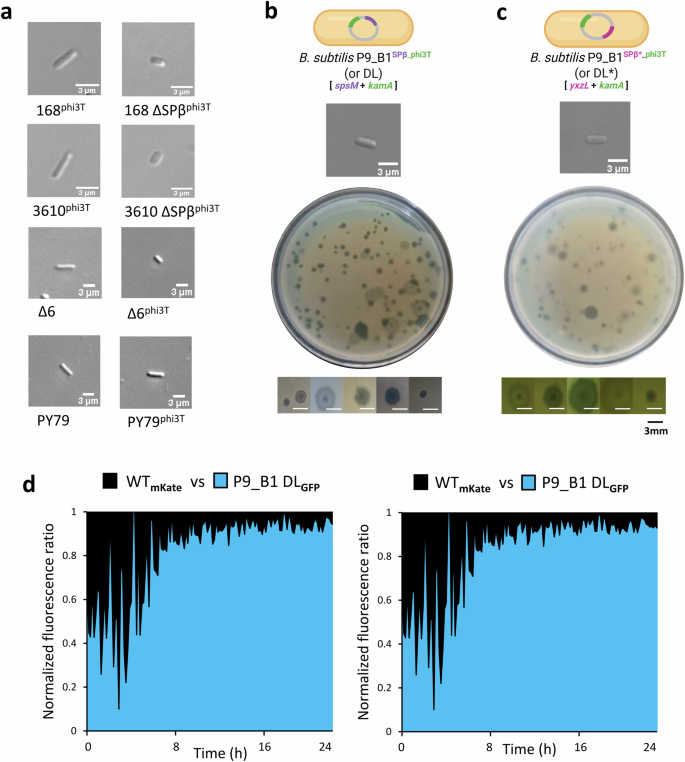
a From top to bottom, micrographs of single cells showing how phi3T prophage influences the cell morphology of strains B. subtilis 168, 3610, and Δ6 when it is the only active prophage in their chromosome. Conversely, phage phi3T seems to have no effect on PY79 cell shape. Micrographs of (b) B. subtilis P9_B1 DL (lysogen for SPβ and phi3T prophages, respectively integrated in spsM and kamA host genes) and (c) B. subtilis P9_B1 DL* (lysogen for SPβ and phi3T prophages, respectively integrated in yxzL and kamA host genes) single cells taken after 16 h of incubation, showing a rod-shaped cell morphology. Confluent plaque assay results testing B. subtilis P9_B1 DL (b) and DL* (c) lysates on B. subtilis Δ6 lawn are also shown. The micrographs show the variety of phage plaques observed in plaque assays. d Results of competition assay in liquid medium. The antagonistic strains P9_B1 WT (black) and P9_B1 DL (light blue) were labeled in co-cultures with two different fluorescent proteins (GFP and mKate) to distinguish between them. The schematic representations of bacterial cells were created in BioRender. Floccari, V. A. (2025) https://BioRender.com/qmq9lb7.
To understand the lack of comparable responses by PY79 to phi3T lysogeny as observed for P9_B1, we compared their respective genomes (Supplementary Fig. 16a). We identified 21 genes present in B. subtilis P9_B1 but absent in PY79, for most of which it was possible to identify the locus in the bacterial genome, but not the predicted function. Three genes (ydaL, ydaM, and ydaN)59 were selected for further investigation (Supplementary Fig. 16b; Supplementary Table 3), revealing that they are not responsible of the differences between the two aforementioned strains. Additionally, we tested and excluded the possible influence of the two genes ppsC (plipastatin synthetase operon)60,61 and ndoA (EndoAI/EndoA toxin/antitoxin system)62,63 in acquisition of the spherical cell morphology by phi3T.
The presence of SPβ rescues B. subtilis from cell morphology changes triggered by phi3T
The presence of SPβ prophage is the major difference between B. subtilis 168 and P9_B1. Therefore, we hypothesized that SPβ prevents the phi3T lysogeny-mediated shift in cell shape in the 168 strain. To test this hypothesis, SPβ was first deleted from both B. subtilis 168 and 3610 strains. Subsequently, the derived strains were lysogenized with phage phi3T. Both 168 ∆SPβphi3T and 3610 ∆SPβphi3T exhibited a spherical morphology (Fig. 7a), just like P9_B1phi3T. Additionally, phi3T was also introduced into P9_B1 pre-lysogenized by SPβ, obtaining the double lysogen (DL) P9_B1SPβ_phi3T. Integration of both phages at their specific loci (spsM for SPβ and kamA for phi3T) was confirmed by specific primers targeting marginal regions of both prophages and host chromosomes, as well as host regions between kamA and spsM (Supplementary Fig. 17). However, intact attB sites were also amplified, suggesting that excision or spontaneous induction of prophages may occur in subpopulations of cells, as previously described16. The presence of both prophages in DL was additionally confirmed by whole-genome sequencing (see Methods).
As expected, DL maintained the rod-shaped morphology (Fig. 7b). Moreover, a similar lack of cell morphology change compared to the traditional rod cell shape was also observed for the P9_B1SPβ*_phi3T (DL*) strain, where SPβ was inserted at the yxzL gene14, distant from phi3T (Fig. 7c). Together, these results strongly suggest that the presence of SPβ rescues B. subtilis from cell morphology changes triggered by phi3T.
Finally, we examined the DL and DL* strains for both spontaneous and MMC-triggered prophage induction, followed by plaque assay. Interestingly, a high phage titer was detected from both DL (SPI, 6×10⁵ PFU mL−1; MMC, 2.3×10⁷ PFU mL−1) and DL* (SPI, 3×10³ PFU mL−1; MMC, 3×10⁶ PFU mL−1) phage supernatants, linked to a variety of plaque morphologies (Fig. 7b, c). There are many reasons underlying the differences in phage plaque size and morphology such as bacterial host, cultivation medium, nutritional state, type of phage, phage genome content, phage absorption rate, and time of lysis16. The variable plaque morphologies are likely the result of prophage induction of a superinfected host, and might be explained by the formation of SPβ and phi3T chimeric variants, that display a higher rate of spontaneous induction16,64.
Lastly, we explored whether the morphology rescue effect in the double lysogens is also associated with fitness rescue. We observed that the DL strain showed a comparable growth dynamic to WT (Supplementary Fig. 15e). Importantly, in contrast to what was observed for WT vs. P9_B1SPβ (where P9_B1SPβ was consistently superior), or WT vs. P9_B1phi3T (where P9_B1phi3T was consistently inferior), the outcome for the DL strain in competition against WT was less obvious (Fig. 7d), even though the fluorescently labeled DL strains behaved as expected, when tested in monocultures (Supplementary Fig. 18). In fact, the simultaneous presence of two prophages and the constitutive expression of a reporter gene could stress the host and affect the outcome of competition. Growth dynamics were also explored by comparing DL* and WT strains, showing a peculiar growth curve for the double lysogen that diverges from WT already in the early exponential phase (Supplementary Fig. 15f).
Since the unconventional spherical phenotype was not observed in the two double lysogens, SPβ may exert a protective role in preventing the morphological shift and negative fitness effects caused by the sole presence of phi3T.
