


Participant demographics and lifestyles
A total of 87 participants were recruited for this study as part of the Global Microbiome Conservancy (http://microbiomeconservancy.org) across three localities: Gua Musang (n = 20), Tasik Banding (n = 30), and Kuala Lumpur (n = 37) (Fig. 1). Gua Musang is an isolated rural location, situated in the deeper parts of forested areas, where communities can live nomadically, engaging in hunting and foraging subsistence activities, and having little exposure to industrialized products21,22. Participants from Gua Musang (age = 32.5 ± 11.8 SD (standard deviation), body mass index (BMI) = 19.4 ± 1.77 SD) self-declare as from the Batek and Mendrik ethnic groups (n = 18 and n = 1, respectively). Statistical comparisons in Table 1 were adjusted for multiple testing using the Benjamini–Hochberg procedure to control the false discovery rate (FDR).
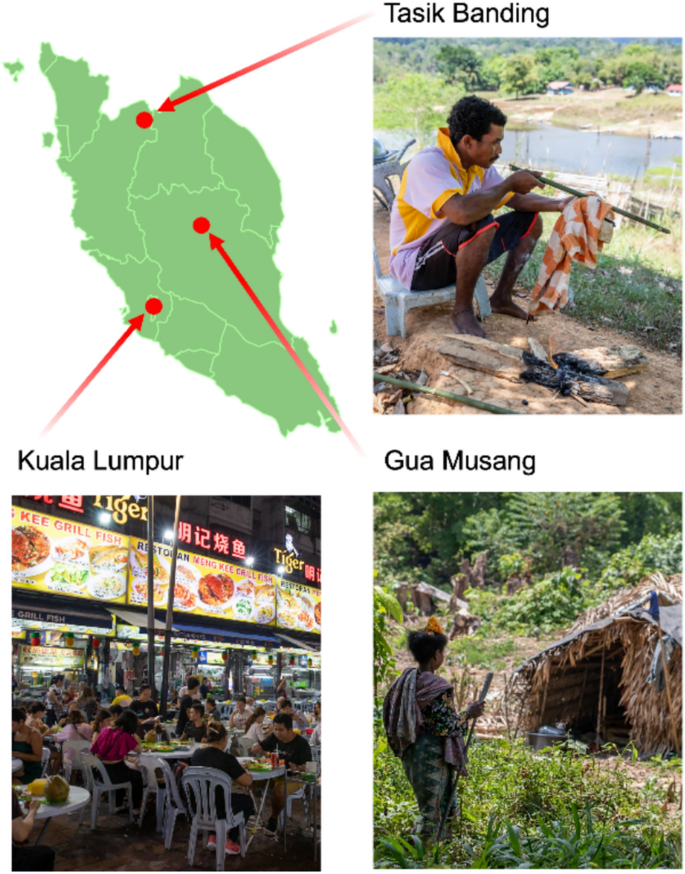
Geographical and lifestyle context of the study populations. The map shows the three study locations in Peninsular Malaysia: Kuala Lumpur (urban), Gua Musang (rural), and Tasik Banding (rural). Photographs depict general lifestyle scenes from the three study locations. The top right image represents Tasik Banding, where indigenous Orang Asli communities live in a rural environment with subsistence practices such as traditional hunting. The bottom left image depicts Kuala Lumpur, a highly urbanized setting characterized by dense infrastructure and access to diverse food markets. The bottom right image represents Gua Musang, a rural locality where Orang Asli communities continue traditional foraging and semi-nomadic lifestyles. The map of Peninsular Malaysia was created using BioRender.com under an academic license.
Tasik Banding is an isolated rural area that is part of the Belum-Temengor forest reserves. Human communities live semi-nomadically, and are mostly dependent on natural resources for their sustenance and livelihoods, engaging in farming, hunting, fishing, and gathering activities. They also receive food support from the Malaysian government including rice meal once or twice a week. The presence of an eco-tourism industry in Tasik Banding also adds a unique dynamic to this rural setting. Tasik Banding participants (age = 33.6 ± 11.6 SD, BMI = 22.8 ± 4.04 SD) self-declare to be from Jahai (n = 28) and Temiar (n = 3) ethnicities (Table 1).
In Kuala Lumpur, the urban communities are exposed to industrialization and have adopted lifestyles heavily relying on processed and mass-produced food products associated with industrial food production methods. Kuala Lumpur participants (age = 23.8 ± 2.85 SD, BMI = 21.4 ± 4.04 SD) are from Chinese (n = 21), Indian (n = 9), Malay (n = 5), Dusun (n = 1) and Thai (n = 1) ethnicities (Table 1).
Apart from the data collected from three different locations with different industrialization backgrounds, Table 1 also highlights the differences in the access to electricity and drinking water, showing that no participants from Gua Musang and Tasik Banding have access to electricity. A substantial proportion of participants from Gua Musang (42.1%) and Tasik Banding (80.7%) relied on untreated and unfiltered water sources, while a smaller fraction transitioned to filtered water (26.3% and 12.9%, respectively). In contrast, most participants from Kuala Lumpur had access to treated and filtered water (67.6%), with only a minority still relying on untreated water (5.4%). This study also shows that some of participants from Gua Musang reside in homes with various floor types, including dirt (26.3%), wooden (42.1%), and concrete (31.6%) floors, while none reported living in houses with covered flooring.
Level of industrialization of lifestyle impacts gut microbiome diversity and composition
We first examined the association of location, urbanism, and sex factors to microbiome alpha diversity (Fig. 2).
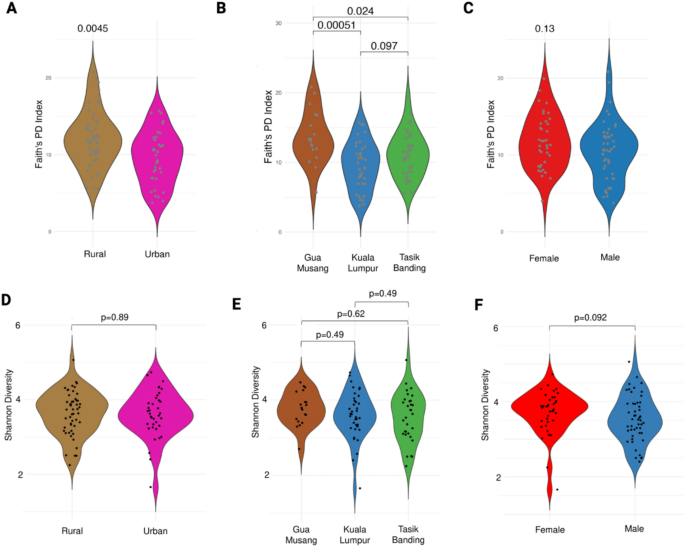
Variation in alpha diversity by urbanization, locality, and sex. This plots present comparisons of gut microbiome alpha diversity across different population groups using Faith’s Phylogenetic Diversity (PD) index and Shannon diversity index. Violin plots illustrate differences in Faith’s PD index by urbanization (A), locality (B), and sex (C). Rural populations exhibit significantly higher phylogenetic diversity compared to urban populations (A Wilcoxon test, p = 0.0045). Across localities, Gua Musang shows the highest diversity (B Kruskal–Wallis test, p = 0.0019), with significant pairwise differences between Gua Musang and Kuala Lumpur (p = 5.1e-4) and Tasik Banding and Kuala Lumpur (p = 2.4e-3). No significant differences were observed between sexes (C, Wilcoxon test, p = 0.13). Violin plots of Shannon diversity index by urbanization (D), locality (E), and sex (F) reveal no significant differences (Wilcoxon tests, all p > 0.05).
We found that rural populations exhibited significantly higher phylogenetic diversity compared to urban populations (Fig. 2A, Faith’s PD index, Wilcoxon test, p = 4.5e-3). However, no significant difference was detected when using the Shannon diversity index (Fig. 2D, Wilcoxon test, p = 0.89), suggesting that while overall species richness and evenness remain comparable, rural populations harbor a more phylogenetically diverse microbiome. Further comparisons across localities revealed significant differences in alpha diversity (Fig. 2B, Faith’s PD, Wilcoxon test, p = 1.9e-3). The gut microbiome of individuals from Gua Musang exhibited significantly higher phylogenetic diversity than Kuala Lumpur. Individuals from Tasik Banding also had higher diversity than those in Kuala Lumpur, though the effect was less pronounced. When analyzing Shannon diversity, no significant differences were observed across localities (Fig. 2E, Wilcoxon test, p > 0.05), reinforcing that phylogenetic diversity, rather than species richness, distinguishes microbiomes across urban and rural settings. Finally, we found no significant differences in microbiome diversity between males and females for Shannon diversity (Fig. 2C, Wilcoxon test, p = 0.13 and Fig. 2F, Wilcoxon test, p = 0.092), suggesting that sex does not strongly influence alpha diversity in this cohort.
Next, we investigated differences in microbial compositions between lifestyles and localities (Fig. 3).
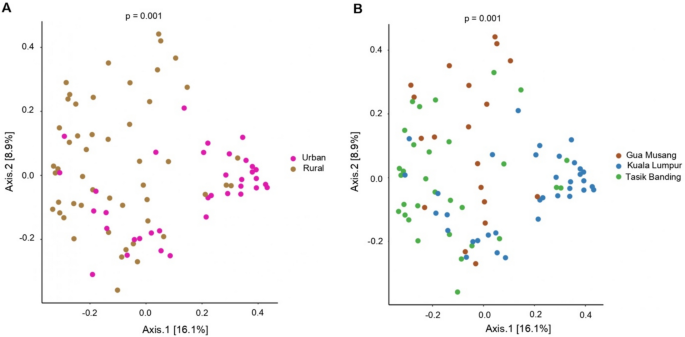
PCoA Ordination of Bray–Curtis Distances showing microbial community variation by urbanization (A) and locality (B). Plots illustrate differences in gut microbiome composition based on Bray–Curtis distances. A Microbial community composition significantly differs between rural and urban populations (Adonis, p = 0.001). B Differences in microbiome composition are also observed across localities (Adonis, p = 0.001).
We found significant differences in microbiome compositions between rural and urban communities (Fig. 3A, Adonis, p-value < 0.001, Supplementary Table 1). These compositional differences may be attributed to dietary habits, environmental exposures, and other lifestyle-related factors. Significant differences in beta diversity compositions were also found when comparing cohorts by locality (Fig. 3B, Adonis, p-value = 0.001, Supplementary Table 2) and when comparing the two rural cohorts together (Fig. 3B), suggesting that environmental and host characteristics specific to each locality drive microbial compositions beyond the effect of population density (urban vs. rural).
Building on these findings, we next examined how host and environmental factors associate with microbiome compositions (Fig. 4), while accounting for confounders. For this, we used redundancy analysis (RDA) and a stepwise forward model selection approach, and we found that locality is the primary predictor of microbial variations (adjusted R2 = 0.056), followed by age (R2 = 0.012), Bristol stool scale (R2 = 0.008), and BMI (R2 = 0.003). Locality was found to be significantly associated with microbiota compositions when also considering these other factors (p = 0.002). However, the other factors did not significantly improve model performance once locality had already been accounted for. The final RDA model constrained 7.75% of the total variation in gut microbiome composition, indicating that while locality and host-related factors influence microbial diversity, a substantial proportion of variation remains unexplained. Additionally, the RDA (Fig. 4) shows an inverse association between Kuala Lumpur and age, reflecting the demographic structure of our dataset, where individuals from Kuala Lumpur tended to be younger than those from Gua Musang and Tasik Banding (Table 1).
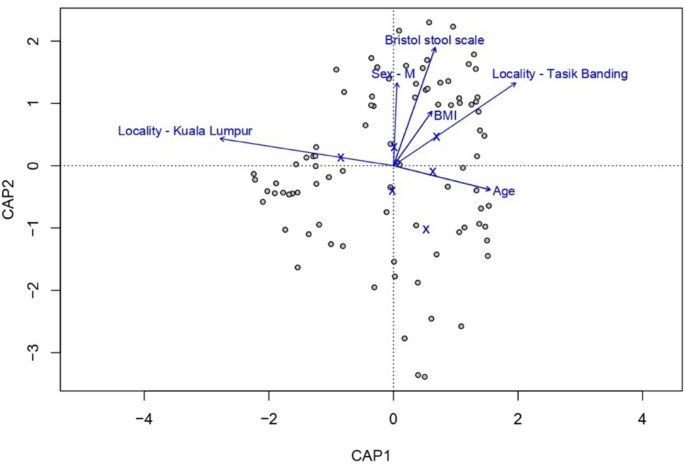
Redundancy analysis of gut microbiome composition with key explanatory variables. RDA was performed to assess the influence of host and environmental factors on gut microbiome composition. The plot displays the relationship between microbial variation and key explanatory variables, with arrows indicating the direction and strength of associations.
Individual taxonomic profiles vary across lifestyles and localities
We next examined the relative abundance of individual gut microbial lineages across different taxonomic levels to look for associations with urbanization and locality (Figs. 5 & 6).
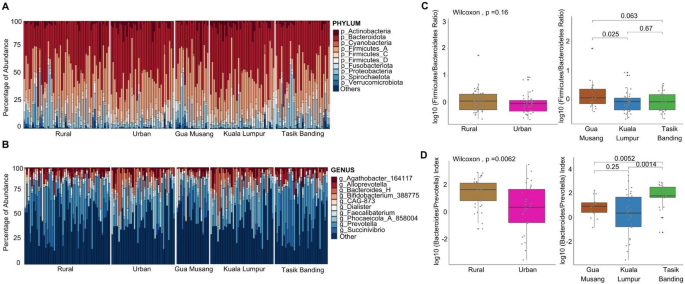
Taxonomic composition (A, B) and key microbial ratios across urbanization and locality (C, D). A Phylum-level taxonomic composition of the gut microbiome across urbanization levels (left) and localities (right). B Genus-level taxonomic composition stratified by urbanization (left) and locality (right). Rural populations exhibit a higher prevalence of Prevotella, while urban populations show an increased abundance of Bacteroides and other genera associated with a more industrialized lifestyle. C Firmicutes/Bacteroidetes (F/B) ratio, a commonly used indicator of microbiome composition, does not differ significantly between urban and rural populations (Wilcoxon test, p = 0.16). At the locality level, the ratio remains relatively stable across Gua Musang, Kuala Lumpur, and Tasik Banding. D log10(Bacteroides/Prevotella) index, a proxy for dietary shifts, reveals a significant difference between urban and rural populations (Wilcoxon test, p = 0.0062). At the locality level, Kuala Lumpur shows a significantly higher Bacteroides/Prevotella ratio compared to both rural localities, Gua Musang (p = 0.0052) and Tasik Banding (p = 0.0014).
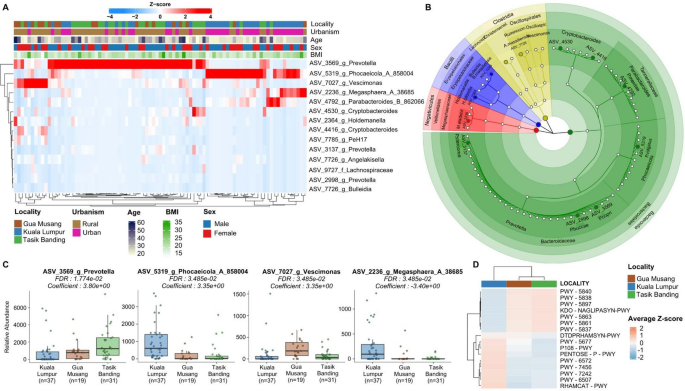
Differentially abundant taxa (A), their taxonomic classification (B), and the median abundance of the top four differentially abundant taxa (C) are shown. A differential abundance analysis was also performed on predicted functional pathway profiles (D). A Heatmap of differentially abundant ASVs across localities. The color scale represents Z-score normalized relative abundance, with red indicating higher abundance and blue indicating lower abundance. Samples are clustered based on microbial composition, revealing distinct taxonomic signatures associated with each locality. The metadata bar on top shows locality, urbanization, age, sex, and BMI. B Circular phylogenetic tree generated using GraPhlAn2, displaying the taxonomic relationships of significantly differentially abundant taxa. C Relative abundance of the four most differentially abundant taxa across localities. Boxplots show significant differences in Prevotella, Phocaeicola, Vescimonas, and Megasphaera, with p-values and effect sizes (coefficients) indicated for each ASV. These taxa are key contributors to microbiome differentiation across populations. D The heatmap displays the average Z-scores of all significant differentially abundant predicted functional pathways across localities, which are represented using a hierarchical clustering based on pathway abundance profiles.
At the phylum level (Fig. 5A), Firmicutes and Bacteroidota were the dominant bacterial phyla across all groups. At the genus level (Fig. 5B), we observed that Prevotella was more abundant in rural populations, while levels of Bacteroides and Phocaeicola are elevated in urban samples. We found that the Firmicutes/Bacteroidetes (F/B) ratio does not differ significantly between urban and rural populations (Wilcoxon test, p = 0.16) (Fig. 5C), nor among localities, suggesting that overall community balance between these two dominant phyla remains relatively stable across environments. In contrast, the Bacteroides/Prevotella ratio (Fig. 5D) was significantly lower in rural populations compared to urban populations (Wilcoxon test, p = 0.0062), confirming a greater relative abundance of Prevotella in rural individuals. At the locality level, Kuala Lumpur exhibited a significantly higher Bacteroides/Prevotella ratio compared to both rural localities, Gua Musang (p = 0.0052) and Tasik Banding (p = 0.0014).
We next accounted for the effect of host confounders on the variation in abundance between localities. We first searched for differentially abundant taxa (Fig. 6), using MaAsLin2 and a general multivariate linear model (see Methods) to detect amplicon sequence variants (ASVs) that are differentially abundant across locality, urbanism, age, sex and BMI variables. We found that several ASVs show significant enrichment or depletion in specific localities independent of confounders, indicating that environmental and lifestyle factors strongly shape the abundance profile of individual microbial lineages (Fig. 6A–C). A taxonomic analysis shows that the most differentially abundant ASVs across locality and lifestyle predominantly belong to Bacteroidota and specific Firmicutes classes, such as Bacilli, Negativicutes, and Clostridia (Fig. 6B).
We were able to identify several ASVs down to the species level that show differences in abundance across localities (Fig. 6A, C). Notably, rural locations are characterized by a higher abundance of Prevotella copri (ASV_3569, adj. p-val = 1.8e-02), a species known to thrive in the gut microbiome of individuals living in non-industrialized or traditional settings, often associated with high-fiber, plant-based diets23. A Vescimonas ASV (ASV_7027) is also showing different abundances across localities, and is elevated in Gua Musang (adj. p-val = 1.8e-02). In contrast, Parabacteroides merdae (ASV_4792) is more abundant in the urban Kuala Lumpur samples24. The latter species is involved in the catabolism of branched-chain amino acids and has been shown to improve insulin sensitivity and glucose tolerance, reflecting a microbiome adapted to a more urban lifestyle with potentially more processed food intake. Similarly, Phocaeicola vulgatus (ASV_5319, adj. p-val = 1.8e-02), another species prevalent in Kuala Lumpur, is a common member of the human gut microbiome with a broad capacity for carbohydrate utilization, aligning well with urban dietary patterns rich in carbohydrates, particularly those derived from processed foods25. Additionally, Megasphaera elsdenii (ASV_2236, adj. p-val = 3.5e-02), found predominantly in Kuala Lumpur, is well-adapted to utilize lactate and glucose, further supporting the carbohydrate-oriented profile of an urban microbiome26.
To gain further insights into the functional capabilities of these microbiomes, we conducted a pathway prediction analysis and identified significantly differentially enriched pathways (Fig. 6D, Supplementary table 3). Using hierarchical clustering, we found distinct patterns in metabolic pathways between Kuala Lumpur and rural localities. Pathways associated with several biosynthesis pathways, including the menaquinol biosynthesis (PWY-5840, PWY-5838, PWY-5897), phylloquinol biosynthesis (PWY-5863, adj. p-val = 4.7e-03), and demethylmenaquinol-8 biosynthesis (PWY-5861, adj. p-val = 5.1e-03), as well as (Kdo)2-lipid A biosynthesis (KDO-NAGLIPASYN-PWY, adj. p-val = 5.5e-03) and 2-carboxy-1,4-naphthoquinol biosynthesis (PWY-5837, adj. p-val = 4.7e-03), were significantly downregulated in the urban Kuala Lumpur group. These pathways are integral to the production of essential vitamins (e.g., vitamin K2) and bacterial cell wall components. Conversely, some pathways related to degradation and fermentation processes were upregulated in Kuala Lumpur. These included succinate fermentation to butanoate (PWY-5677, adj. p-val = 5.5e-02), pyruvate fermentation to propanoate (P108-PWY, adj. p-val = 5.2e-03), and pentose phosphate pathway (PENTOSE-P-PWY, adj. p-val = 4.7e-03), as well as pathways involved in breaking down complex sugars and polysaccharides, such as chondroitin sulfate degradation (PWY-6572, adj. p-val = 2.3e-03), β-(1,4)-mannan degradation (PWY-7456, adj. p-val = 1.2e-02), D-fructuronate degradation (PWY-7242, adj. p-val = 4.6e-03), and fucose and rhamnose degradation (RHAMCAT-PWY, adj. p-val = 3.7e-02). These findings may reflect the influence of urban diets rich in processed carbohydrates and animal-derived products, which promote pathways associated with sugar metabolism and degradation of dietary glycans.
