


Transposon sequencing reveals genetic remodeling important for S. aureus survival in intracellular infection
First, we established a cell infection model using a S. aureus transposon (Tn) mutant library and analyzed the genes required for the early and late phases of intracellular infection (Fig. 1a). We wanted a minimal bottleneck effect for our genetic analysis, so we first assessed an infection efficiency of the methicillin-resistant S. aureus (MRSA) strain USA300 in three cell lines relevant to S. aureus infection. A549 cells derived from the lungs allowed entry of almost all bacterial cells, while 50% and less than 10% of the bacteria entered murine macrophage (Raw264.7) cells and human keratinocyte (HaCaT) cells, respectively (Fig. 1b). Based on the finding that A549 cells are permissive to bacterial infection and survival compared to the other cell lines, we selected this cell line for our model. We next examined whether A549 cells are permissive to the entry of several other MRSA strains or methicillin-sensitive S. aureus (MSSA) strains. The MRSA strains USA300 and MW2 demonstrated the highest infection rates, whereas MSSA strain Newman was non-invasive (Fig. 1c). These results show that there can be very large differences in cell infection efficiency among different pathogenic S. aureus strains20. We selected USA300 for genetic profiling because it represents the predominant community-acquired MRSA clone in North America and is therefore of high current interest21,22. We found that USA300 is not only able to efficiently invade A549 cells but also proliferates intracellularly up to 8 h post-infection (Fig. 1d), consistent with previous observations5,23. Interestingly, we did not observe proliferation for the MSSA strain HG003, which is in the same clonal complex as USA300 (Supplementary Fig. 1), showing that USA300 is better adapted for intracellular growth. To confirm that USA300 cells indeed grow and divide intracellularly, we examined infected A549 cells using transmission electron microscopy (Fig. 1e). At 4 h post-infection, we observed multiple S. aureus cells with septa, indicating that these bacteria were in the process of division inside the host cells when the samples were processed. Growth and division in the intracellular environment were also confirmed by fluorescence microscopy using a USA300 strain expressing FtsZ-GFP (Fig. 1f).
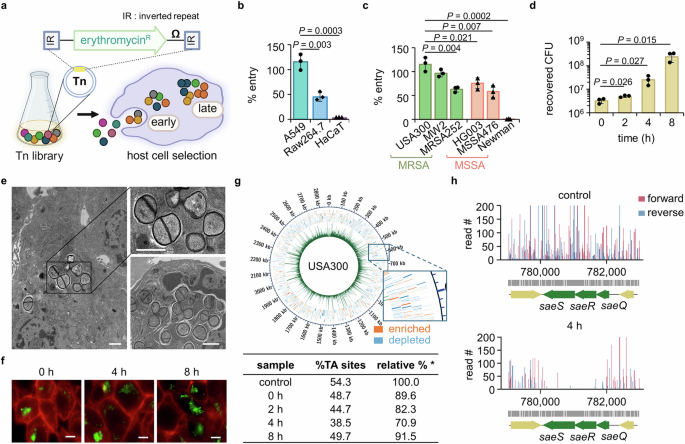
a To determine genes essential for the early entry into and late survival in host cells, A549 cells were infected with the USA300 Tn library for 1.5 h, after which extracellular bacteria were removed by gentamicin. Samples collected right after gentamicin were defined as 0 h throughout the manuscript. Image created in BioRender (Lee, W. (2025) https://BioRender.com/bytpvde). Extent of infection (b) of USA300 into host cells (A549, Raw264.7, and HaCaT) and (c) of MRSA and MSSA strains into A549 cells were determined by cell infection assay (\(\%\;{\rm{entry}}=\,\frac{{\rm{CFU}}\; {\rm{recovered}}\; {\rm{at}}\;0\;{\rm{h}}}{{\rm{input}}\; {\rm{CFU}}}\times 100\)). d The CFU were counted at 0–8 h post-infection as a measure of USA300 survival inside the A549 cells. Data in b–d are presented as the mean ± SD (n = 3 biological replicates); P values are calculated by a two-sided, unpaired Student’s t-test. Source data for b–d are available in the Source Data file. e The intracellular bacteria were examined by transmission electron microscopy at 4 h post-infection (scale bar = 1 μm). f Entry and survival of FtsZ-GFP-expressing USA300 in A549 cells were inspected by fluorescence microscopy. The cell membrane and bacteria are shown in red and green, respectively (scale bar = 5 μm). The images in e–f are representative of three independent experiments. g The entire sequenced genome at 0 h was plotted using Circos with the green peaks representing read counts for each TA site and blue and orange outer squares representing genes with counts lower (depleted) and higher (enriched) than those of the control library, respectively. The % TA sites (% TA sites detected out of all TA sites in the genome) show the coverage of the genome by Tn-seq and are presented in a table (\( * \;{\rm{relative}}\%=\,\frac{\%{\rm{TA}}\; {\rm{sites}}\; {\rm{of}}\; {\rm{an}}\; {\rm{experimental}}\; {\rm{sample}}}{\%{\rm{TA}}\; {\rm{sites}}\; {\rm{of}}\; {\rm{a}}\; {\rm{control}}\; {\rm{Tn}}\; {\rm{library}}\;(54.3\%)} \times 100\)). h The read counts generated by sequencing in both forward (red) and reverse (blue) directions for each TA site within the saeQRS locus of the control and 4 h samples were plotted using R.
We next infected the A549 cells with a USA300 Tn mutant library at a multiplicity of infection (MOI) of 10, which resulted in full recovery of input bacteria. The mutant library used in this study is a high-density library containing more than 760,000 Tn mutants made by phage-based transposition24. The number of mutants exceeds the number of TA sites in the S. aureus genome because the library is composed of six bar-coded sublibraries, each produced using a slightly different Tn construct. Some constructs have outward-facing promoters that can minimize the polar effects of insertion on downstream gene expression. Tn mutants recovered right after infection (at 0 h post-infection) were used to identify genes required for the early stage of infection, while Tn mutants recovered at 2, 4, and 8 h post-infection were analyzed to identify genes required for intracellular proliferation (Fig. 1a). A Tn library not exposed to the host cells was used as an input control. After sequencing, the read counts due to the Tn insertions for each gene were mapped to the genome of USA300, generating a complete profile for all time points. The percentage of TA sites containing the Tn insertions was comparable to the input at each time point, suggesting a minimal bottleneck effect (Fig. 1g, table). Moreover, Circos plots of the read counts for each TA site confirm high coverage of Tn mutants across the genome (Fig. 1g and Supplementary Fig. 2, green bars). In these plots, genes for which reads were depleted and enriched compared with the input control are represented in blue and orange (Fig. 1g, magnification), respectively. Among the genes required for intracellular survival (depleted reads compared with the input control), we found SaeRS, a TCS previously shown to be required during host invasion (Fig. 1h), which validates our genetic analysis25.
S. aureus faces nutrient limitation during intracellular infection
Since we aimed to identify genes required for intracellular infection, we focused on only the depleted genes in the Tn-seq analysis. For this, we plotted the read counts of the genes from each sample against those of the input and set up a significance cut-off as 1.3-fold decrease of log2 fold change with a P value ≤ 0.05 (Fig. 2a). We have excluded the genes with a small read count (<50) in the control input library from our further analysis as done in previous studies26,27. Based on our Tn-seq datasets, we categorized genes as early or late essential based on changes of read counts during an 8-h infection period. A total of 226 genes were identified as essential for intracellular infection from the early stages to the proliferation (late) stages; 11 genes were categorized as early essential, 44 genes as essential for proliferation (late essential), and 72 genes essential for both the early and proliferation stages (Fig. 2b). Genes that were substantially changed and clustered were represented as a heat map (Fig. 2c) with a complete list provided in Supplementary Fig. 3. Importantly, as marked by the black lines above the genes in Fig. 2c, multiple genes belonging to the same functional group are consistently depleted, thereby providing cross-validation for their functional importance.
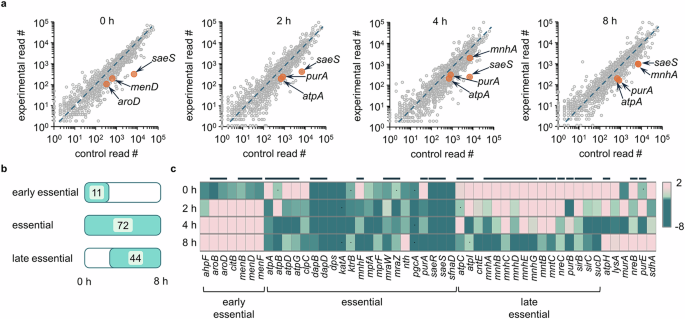
a Read counts from samples collected at 0 h and during intracellular survival (2–8 h post-infection) were plotted against the read counts of the respective genes of the control (not exposed to host cells) sample. The saeS gene is represented on the graphs as a gene depleted at all time points, while menD and aroD are representative genes depleted at an earlier stage of infection. Genes, such as purA, atpA, and mnhA, represent genes that appear later during the intracellular infection. Source data is available in the Source Data file. b Genes that demonstrated a substantial decrease in their read counts (log2 fold change ≤ −1.3, P value ≤ 0.05) were classified into genes that are entry-specific (early essential; substantially depleted at 0–2 h post-infection), common for entry and post-entry events (essential; substantially depleted at 3 or more time points throughout the experiment (0–8 h)), or post-entry survival-specific (late essential; depleted only at 8 h, 2 + 8 h, or 4 + 8 h post-infection). The numbers of genes in each category are presented in a table. c Representative early essential and late essential genes, and genes essential throughout the infection period are expressed as a heat map. The heat map also includes representative genes that are depleted at one or two time points but do not fall into any of the classification categories. Genes were considered essential if log2 fold change ≤ −1.3 with P value ≤ 0.05; dots on the heat map present genes that meet the log2 fold change criterion but not the P value criterion, and the black lines above the heat map express genes appearing in a gene group.
In Fig. 3a, we summarized the sets of genes required for the intracellular infection, which include genes involved in cell wall biogenesis (murA, mprF, and pgcA), pathogenesis (sae, mra and nre loci), nutrient/ion uptake (i.e., mnh, mpf and sir loci), stress response (i.e., clpC and ahpF), energy production (i.e., atp and pur loci), and carbon source utilization (i.e., citB and dap locus). We also included a full list of genes required at each stage of infection by listing all genes that appeared to be required at least at one time point during the infection period (Supplementary Fig. 3). Among these genes, the greatest depletion across all time points was observed in saeS and saeR. The SaeRS TCS responds to host environmental cues (i.e., calprotectin, oxidative stress, and neutrophil proteins) and relays signals to produce virulence factors for adhesion, proteolysis, and hemolysis (i.e., hla)28. Therefore, SaeRS plays a central role in adaptation to the host milieu. Additionally, we identified other transcriptional regulators, nre and mra loci, as essential for intracellular survival. However, we did not observe srrA, which is involved in responding to nitric oxide stress, perhaps because A549 is an epithelial cell line with weak phagocytic activity29. Interestingly, we found groups of genes for which the extent of depletion was not consistent throughout the sampling time points (included in the last category in Supplementary Fig. 3). Among these, murA was depleted at 0 and 4 h but not at 2 and 8 h (Fig. 2c). In addition, menaquinone (MQ) biosynthesis genes such as men and aro loci were substantially depleted in read counts during the early stage rather than the late stages therefore classified as early essential. MQ is electron-charged between ATP synthase and cytochrome oxidase in the ATP generation system of S. aureus30,31. When we analyzed the whole locus of the men operon, most genes were depleted, suggesting a requirement for MQ during the early stage of infection. To validate genes involved in this early stage, we tested individual mutants with the Tn insertion in the identified genes. Mutants of the genes found to be involved in the early phase of infection (i.e., aroB or menD) invaded less into the host cells than the wild-type strain, as shown in Fig. 3b. Although mutants with the Tn insertion at these genes grow slowly (Supplementary Fig. 4a), we do not think slow growth explains these early phase results because other mutants with growth defects did not appear in our Tn-seq results.
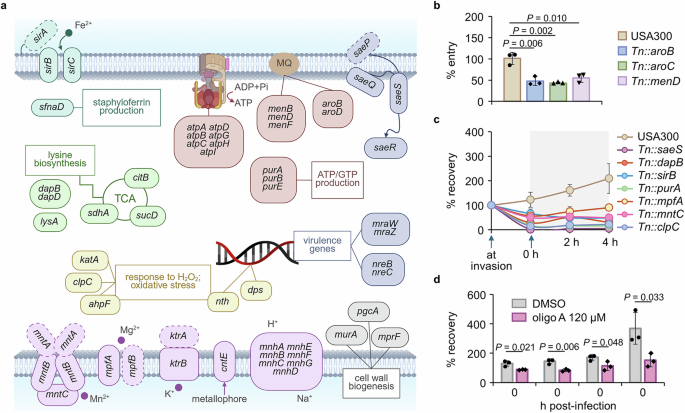
a The genes involved in intracellular survival are grouped by their functions, and the selected pathways are presented in a diagram. Genes that were not substantially depleted but are needed as part of the functional group are marked with dotted lines. MQ, menaquinone. Image created in BioRender (Lee, W. (2025) https://BioRender.com/sfrjhgv). The mutants of selected genes were obtained from the Nebraska Tn library and were confirmed for their role in (b) intracellular entry or (c) both entry and post-entry survival by the infection assay (\(\%\;{\rm{entry}}=\,\frac{{\rm{CFU}}\; {\rm{recovered}}\; {\rm{at\;}}0\;{\rm{h}}}{{\rm{input}}\; {\rm{CFU}}}\times 100\); \(\%\;{\rm{recovery}}=\,\frac{{\rm{CFU}}\; {\rm{recovered}}\; {\rm{from}}\; {\rm{cells}}}{{\rm{input}}\; {\rm{CFU}}}\times 100\)). d USA300 pre-exposed to 120 μM of oligomycin A (oligo A), an ATPase inhibitor, was examined for the extent of infection into and proliferation inside the host A549 cells in the presence of 120 μM oligomycin A (\(\%\;{\rm{recovery}}=\,\frac{{\rm{CFU}}\; {\rm{recovered}}\; {\rm{from}}\; {\rm{cells}}}{{\rm{input}}\; {\rm{CFU}}}\times 100\)). Data in b–d are presented as the mean ± SD (n = 3 biological replicates), and the P values are calculated by a two-sided, unpaired Student’s t-test. The source data for b–d are available in the Source data file.
Along with the early essential group of genes, we found another group of genes that were depleted to a greater degree during the late stage of infection or were depleted throughout the 8-h period. These include genes involved in ATP generation (atp and pur loci) and multiple genes related to nutrient uptake: transmembrane transporters (i.e., cntE and mnh locus) that transport metals and ions across the membrane and iron acquisition genes (i.e., sir locus and sfnaD) involved in siderophores or iron acquisition. Finally, we also identified genes related to the oxidative stress response (i.e., nth and katA) and general stress response (i.e., clpC) to be essential for survival in the intracellular milieu (Fig. 3a). These results suggest that intracellular S. aureus faces a severe limitation of nutrients, including essential metal ions. In addition, the essentiality of genes involved in the TCA cycle (i.e., citB and sucD) suggests that S. aureus may become heavily dependent on the TCA cycle and electron transport chain (ETC) to produce ATP, since substrate-level ATP production via glycolysis might become limited due to the limited availability of glucose or other hexose sugar sources while non-carbohydrate carbon sources such as lactate or fatty acid may be more available in the intracellular environment of the host cell. To validate these genes, we chose key genes in each pathway, and mutants of these genes showed no detectable growth defects in TSB medium (Supplementary Fig. 4b) but low fitness when tested individually in the A549 infection assay (Fig. 3c and Supplementary Fig. 4c). Also, the operon analysis showed that many genes required for intracellular invasion and survival were included within the same operon, further validating our Tn-seq analysis (Supplementary Fig. 5). Since we found multiple genes for the ETC including MQ biosynthesis genes, atpA and sucD, we wanted to validate the essentiality of ATP generation via the ETC by testing bacterial survival in A549 cells in the presence of oligomycin A, a macrolide that inhibits the F1F0-ATPase complex by binding to the F0 subunits 6 and 932. As shown in Fig. 3d, at a concentration that affects neither bacteria nor the host A549 cells (Supplementary Fig. 6a-b), bacteria exposed to an ATPase inhibitor demonstrated reduced infection and survival in the intracellular environment.
S. aureus extracellular proliferation in human blood requires different genes from those required for intracellular survival
Invasive S. aureus infections result when S. aureus forms colonies on vulnerable bodily surfaces such as abraded skin and somehow reaches the circulatory system, causing bacteremia33. Since blood is considered a major extracellular environment for bacteria during systemic infection, we aimed to understand the physiological and metabolic changes that occur in S. aureus during bacteremia by identifying genes essential for survival in whole blood and plasma using the USA300 Tn library (Fig. 4a). The human blood used in this study was commercially sourced and treated with heparin, so the immune cells are likely mostly deactivated. Utilizing this system, we aimed to study the fitness of mutants in the blood as a host environment with a distinct set of nutrients and carbon sources without rapid clearance by immune cells. We first monitored the growth of USA300 in both human whole blood and plasma by measuring colony forming units (CFU) over 36 h. We found that in both whole blood and plasma, the CFU of USA300 reached a plateau at 9 h (Fig. 4b and Supplementary Fig. 7a), which is comparable to the growth profile in the TSB medium (Supplementary Fig. 4a-b). We used electron microscopy to examine whether the majority of USA300 remained outside of red blood cells (RBC) and found only minor infiltration of USA300 into RBC (Supplementary Fig. 7b).
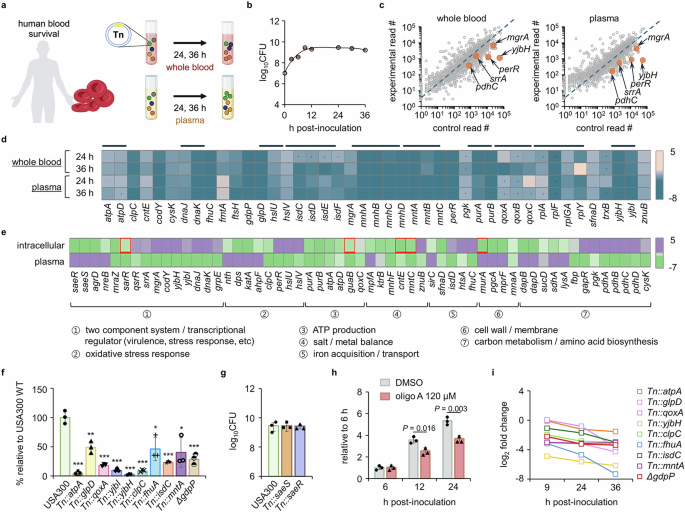
a The USA300 Tn library was cultured in human whole blood and plasma for 24 and 36 h, after which the bacteria were collected and prepared for Tn-seq. Image created in BioRender (Lee, W. (2025) https://BioRender.com/gwn8ee3). b The growth of USA300 was examined for 36 h. c Gene read counts from a 24 h post-inoculation sample were compared to those of the Tn library grown in TSB. Representative genes from the list of substantially depleted genes are presented on the plot. d Representative genes depleted in whole blood and plasma are expressed as a heat map (dots: genes that meet the log2 fold change criterion but not the P value criterion; black lines: gene groups). e Representative genes required for intracellular (2 h) and plasma (36 h) survival are compared (red squares: genes for which the 4 or 8 h post-infection read counts were used since they were either defined as late essential or were not depleted at 2 h but rather at other time points). The mutants of selected genes were validated for their (f) essentiality and (g) non-essentiality for survival in whole blood. The mutants were cultured in whole blood for 24 h, and CFU were counted to measure the survival. * P < 0.05; ** P < 0.01; *** P < 0.001 compared to the USA300 strain. The exact P values are available in the Source Data file. h USA300 pre-exposed to 120 μM of oligomycin A (oligo A) was placed into whole blood in the presence of oligomycin A to investigate the essentiality of ATP production for blood survival. Data in b and f–h are presented as the mean ± SD (n = 3 biological replicates), and the P values are calculated by a two-sided, unpaired Student’s t-test. i The log2 fold change of the mutants of genes essential for blood survival was expressed in a time course up to 36 h post-blood inoculation. Source data for b, c and f–i are available in the Source Data file.
For Tn-seq analysis, we collected S. aureus cells at 24 or 36 h based on the growth profile (Fig. 4b and Supplementary Fig. 7a). This allowed S. aureus to grow for over 10 generations, enabling sufficient time for identification of mutants with lower fitness. We first plotted the read counts from the Tn library cultured in whole blood or plasma against those from TSB media (Fig. 4c and Supplementary Fig. 8a). Primarily, we focused on the depleted genes. A total of 115 genes were found to be essential for survival in the blood (log2 fold change ≤ −1.2; P value ≤ 0.05), and we found no notable differences between genes essential for survival in plasma and those essential for survival in whole blood (Supplementary Fig. 8b). Representative depleted genes are displayed in Fig. 4d. Among these were genes related to metal ion uptake (i.e., isd, mnh, and mnt loci), stress response (i.e., yjb locus, clpC, and trxB), and ATP metabolism (i.e., atp and qox loci). We further compared the depleted genes with those depleted during intracellular infection. We identified distinct genes essential for each growth condition and classified them into seven major functional groups (Fig. 4e). We found that genes encoding major TCSs of S. aureus, including saeRS, agrD, sarR, srrA, and mgrA, are differentially required in the two environments: saeRS is required for intracellular survival, while srrA is necessary for survival in blood, suggesting that different groups of TCSs are required for survival in these two environments. Genes related to oxidative stress responses, such as perR and hslU, were identified only in the blood conditions, suggesting that S. aureus may face more oxidative stress in the bloodstream compared to the intracellular environment of non-phagocytic cells. However, genes responsible for ATP production (i.e., pur and atp loci) and ion/metal balance (i.e., mnh and mnt loci) were depleted in both conditions, suggesting that in both conditions, S. aureus may be exposed to limited nutrients and an environment where ATP is primarily produced through the electron transport chain. Similar to the results from the intracellular invasion, the operon analysis further confirmed that many genes required for survival in blood were within the same operon (Supplementary Fig. 9).
To validate our Tn-seq results, we selected mutants from the seven functional groups and tested them for their growth in blood. As shown in Fig. 4f, these mutants showed lowered fitness in blood. Importantly, we were able to confirm the Tn-seq result for saeS and saeR; as shown in Fig. 4g, we found no growth phenotype of these mutants in blood, suggesting that S. aureus regulates genes independently of SaeRS in blood. Regarding genes related to ATP production, we were also able to validate their requirement using oligomycin A. As shown in Fig. 4h, in the presence of oligomycin A, the growth of USA300 was delayed. Finally, we note that we observed no growth defects of the tested mutants in TSB medium, suggesting that the reduced fitness in blood is not due to the inactivated genes (Supplementary Fig. 4b and 10). Additionally, since the mnh operon appeared to be essential for survival in human blood, we generated ΔmnhF for validation of its essentiality for blood survival. Although the mnhF mutant demonstrated growth defects compared to wild type (Supplementary Fig. 11a), the extent of reduced blood survival within 48 h surpasses the growth retardation (Supplementary Fig. 11b), implying that the reduced fitness is not simply due to slow growth caused by gene inactivation. In addition, the time-dependent decrease in the read counts of the genes provides validation for the essentiality of these genes for blood survival (Fig. 4i).
S. aureus in human blood remodels its metabolism to allow simultaneous utilization of lactate and glucose
Next, we sought to identify key metabolic pathways involved in bacterial survival and growth in human blood. Since human blood contains distinct nutrients, particularly the available carbon sources, and since carbon source utilization is pivotal for bacterial survival, we have re-evaluated our Tn-seq data from this perspective. Interestingly, in the blood samples we found a substantial enrichment of reads due to the Tn insertions in ccpA, which is involved in catabolic repression in S. aureus (Fig. 5a). We confirmed this enrichment by using a ccpA deletion mutant, which exhibited enhanced growth in human blood (Fig. 5b, c) with the growth profile in TSB shown in Supplementary Fig. 11c, d. CcpA regulates a selective utilization of carbon sources when multiple carbon sources are available34,35. This result led us to investigate the nutrient composition in human blood. We focused on carbon sources that directly enter glycolysis and the TCA cycle, which include amino acids, glucose, and lactate. As previously reported, we found that human blood contains high concentrations of glucose (0.8 mM), lactate (1.3 mM), and amino acids (Supplementary Fig. 12)36. First, we examined the consumption of carbon sources by S. aureus in blood. As shown in Fig. 5d, S. aureus simultaneously consumed lactate and glucose. Typically, bacteria prefer glucose over lactate or acetate when both carbon sources are available, and this is regulated by catabolic repression37,38,39. When we monitored carbon source consumption in TSB media containing both 10 mM glucose and 10 mM lactate, we observed a typical pattern in which S. aureus initially consumed glucose until it was depleted and then began to utilize lactate (Fig. 5e). The simultaneous utilization of carbon sources has also been observed in Mycobacterium tuberculosis40,41. However, unlike M. tuberculosis, S. aureus exhibited the ability to adapt its mode of catabolic repression and shifted to a simultaneous mode only in the host environment, which conferred a fitness advantage.
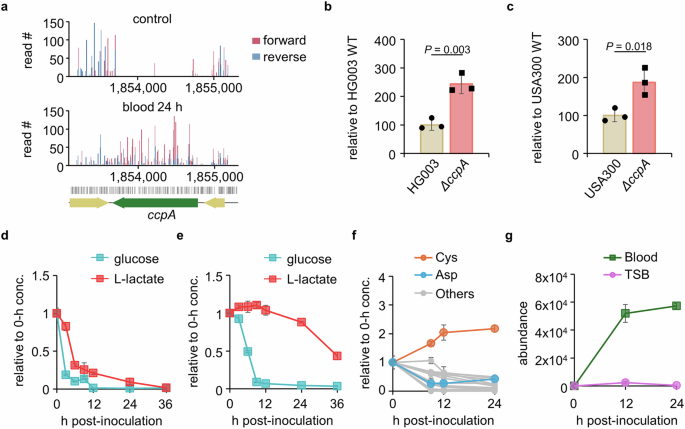
a The read counts for all TA sites within the ccpA gene detected by sequencing in both forward (red) and reverse (blue) directions were plotted using R. For identification of the role of the ccpA gene for bacterial growth in blood, ΔccpA strains generated in (b) HG003 and (c) USA300 strains were cultured in blood for 24 h and were counted for CFU. WT; wild-type. For the measurement of lactate and glucose consumption of USA300 in blood and TSB, bacteria were cultured in (d) blood or (e) TSB for up to 36 h. At designated time points, blood and TSB samples were centrifuged for the collection of plasma and supernatant, respectively, which were prepared for mass spectrometric analysis. f USA300 was cultured in human whole blood for up to 36 h for the measurement of amino acid consumption. At designated time points, blood was centrifuged for plasma collection and prepared for mass spectrometric analysis (others include Ala, Arg, Asn, Glu, Gln, His, Leu, Lys, Met, Phe, Pro, Thr, Trp, Tyr, and Val). g For the measurement of bacterial bacillithiol, USA300 was inoculated into human whole blood or TSB for 9, 12, or 24 h. At designated time points, samples were centrifuged for the collection of bacterial cells, after which the bacterial cells were quenched, lysed by bead beating, and prepared for mass spectrometric analysis. Bacillithiol levels at each time point were normalized to log10 bacterial CFU. Glucose, lactate, amino acid concentrations, and bacillithiol levels in d–g were measured using LC/MS-TOF, and the abundance of extracted metabolite ion intensities was acquired using Profinder 660. All data in d–g are presented as the mean ± SD (n = 3 biological replicates). Source data is available in the Source Data file.
Additionally, we monitored the concentrations of amino acids during the 24-h blood culture and observed that S. aureus actively consumed all amino acids except cystine (Fig. 5f). Interestingly, we found that S. aureus produced cystine over two-fold compared to the control. In line with this data, we identified substantial depletion of cysK, the final enzyme in cysteine biosynthesis, suggesting the essentiality of this gene for survival in the blood environment (Fig. 4d)42. The cysK is the only gene we found related to amino acid biosynthesis, further validating the results of cystine increase in blood. Interestingly, in blood, we found that genes such as perR, trxB, and hslUV were substantially depleted in the blood environment, indicating that S. aureus experiences oxidative stress in blood. Bacterial thiols act as protective agents against oxidative stress, and in S. aureus these include bacillithiol (N-cysteinyl-α-D-glucosaminyl-L-malate), a hexosamine conjugated to L-cysteine43,44. Indeed, aligned with the cysteine accumulation results, we observed that bacillithiol levels increased sustainably over time in the USA300 strain cultured in blood. However, we found only a minimal increase in the intracellular bacillithiol levels in USA300 during the stationary phase when cultured in TSB (Fig. 5g). Therefore, the depletion of genes related to oxidative stress is consistent with the requirement of cysK and the accumulation of cysteine and bacillithiol in the blood environment. To survive in blood, S. aureus depends on genes related to response to oxidative stress, including those associated with bacterial thiol synthesis. Furthermore, our results indicate that S. aureus adjusts its metabolism to better adapt to the extracellular host environment, allowing for more efficient utilization of available carbon sources and response to oxidative stress.
The genes required for invasion into the liver or lungs show substantial overlap with the genes important for extracellular survival of S. aureus
Next, we attempted to identify how S. aureus adapts to different host organs. For this, we decided to use a mouse USA300 infection sepsis model. First, we tested different CFU administered through the tail vein and chose the dose resulting in an 83% survival rate at 48 h post-infection. For Tn-seq, based on the dose, we infected a total of 2 × 10⁸ CFU of the USA300 Tn library, and after 24 h, we separately recovered the surviving Tn mutants from six organs for sequencing (Fig. 6a). Among these six organs, the CFU from the kidneys were the highest, while those of the heart, brain, and spleen were lower, as expected. However, interestingly, in our Tn-seq analysis, we found a very low diversity of Tn mutants in the kidneys. This suggests that the kidneys are relatively hard to infect, but mutants able to do so may encounter a less hostile growth environment than in other organs. In contrast, we recovered a low count of CFU in the spleen, but the mutants were relatively more heterogeneous than in the kidneys, suggesting that there is a lower bottleneck to entry but an unfavorable environment inside the spleen for S. aureus replication. For a numerical representation of these data, we have generated a heterogeneity (HTR) score by normalizing % TA sites (TA sites detected in experimental samples out of all the TA sites in the genome) by the total recovered CFU from each organ (Fig. 6b). Higher HTR means higher diversity of recovered mutants. Using the counts of CFU and HTR scores, we categorized the six organs into three groups: (I) high CFU and high HTR (liver and lungs), (II) high CFU and low HTR (heart, kidneys, brain), and (III) low CFU and low HTR (spleen). Group I includes organs that show high recovery of CFU (log10CFU > 5) and diversity of mutants (HTR score > 4), implying little physical barrier for bacterial invasion and survival. Group II includes organs with high CFU but low HTR (score <4), suggesting that a bottleneck limited mutant entry. Permissive growth conditions after the bottleneck resulted in a clonal mutant population. Group III includes the spleen, which shows low CFU (log10CFU < 5) with low HTR, implying that this organ provides an unfavorable environment for both entry and growth of bacteria. Since bottlenecks limit genetic diversity in the mutant pools for organs in groups II and III, we focused on organs in group I, the liver and lungs, which showed a high CFU with HTR score > 4, for further gene analysis. In addition, because S. aureus is common in lung infections, data generated from the lungs may be of clinical relevance45. Tn data for each organ identified 119 depleted genes for liver and 81 depleted genes for lungs (liver − log2 fold change ≤ −2 with P value ≤ 0.01; lungs − log2 fold change ≤ −4 with P value ≤ 0.01) (Fig. 6c and Supplementary Fig. 13).
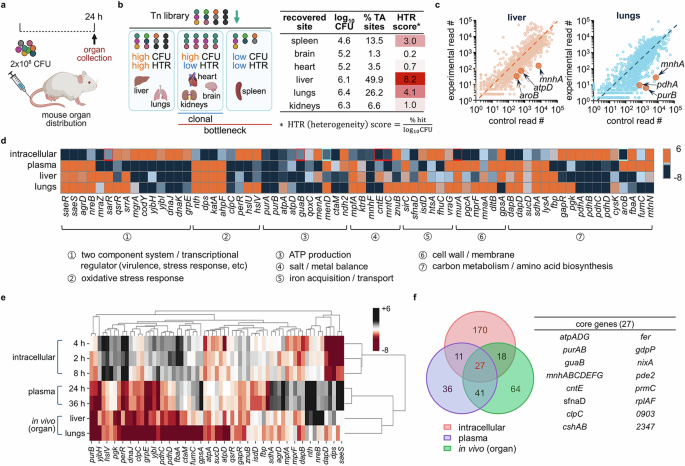
a Mice (BALB/c, 8-week-old, male) were infected with 2×10⁸ CFU of the USA300 Tn library via tail vein injection. Mice were euthanized at 24 h post-infection upon which organs were collected and prepared for Tn-seq. Image created in BioRender (Lee, W. (2025) https://BioRender.com/c7082qe). b Log10 of bacterial CFU, % TA sites (TA sites detected in experimental samples out of all the TA sites in the genome), and HTR scores (\(\frac{\%\;{\rm{TA\; sites}}}{{\log }_{10}{\rm{CFU}}}\)) are presented in a table. The organs were classified into three groups (high CFU (log10CFU > 5) – high HTR (HTR > 4); high CFU – low HTR (HTR < 4); low CFU (log10CFU < 5) – low HTR). Image created in BioRender (Lee, W. (2025) https://BioRender.com/ngl11mx). c Gene read counts from lungs and liver were plotted against the read counts of the respective genes of a control Tn library. Representative genes are marked on the plot. Source data is available in the Source Data file. d Genes essential for intracellular survival (2 h), plasma survival (36 h), and survival in organs (both liver and lungs) are compared in a heat map (red squares: genes for which the 4 or 8 h post-infection read counts were used because they were either defined as late essential or were not depleted at 2 h but rather at other time points; blue squares: genes for which the 0 h read counts were used because they were defined as early essential). e Gene clustering analysis was performed using the seaborn, clustermap Python package (v.0.12.2) using all genes from d, but aroB, menA, and menD were excluded since they were early essential genes that do not appear at 2, 4, or 8 h post-infection. f The numbers of genes that are specifically and commonly essential for intracellular, blood, and organ survival are presented in a Venn diagram, and the 27 core genes that are essential for infection in all three host environments (intracellular, blood, and intra-organ) are listed in a table.
As shown in Fig. 6d, in both organs we identified genes encoding TCSs and associated regulators, including mgrA and yjb locus. We also found genes for ATP production (atp locus, qoxC, and ndh2) and genes related to the oxidative stress response (Fig. 6d, groups 2 and 3). Notably, the oxidative stress response genes found to be important in the liver and lungs were different from those involved in intracellular survival. Similarly, TCS SaeRS and cell wall biosynthesis and metabolism-associated genes (mpfA, murA, lysA, and dapB) were depleted only in an intracellular environment but not in blood and intra-organ environments. Most genes depleted in the liver and lungs were shared, but several, such as copZ and gpsA, were depleted only in the lungs (Supplementary Fig. 13), and the essentiality of the functional groups was further validated by the operon analysis (Supplementary Fig. 14). The essentiality of genes was confirmed with the atpD mutant being less infective in both liver and lungs (Supplementary Fig. 15a), while copZ and pyrE genes were only essential for lung or liver infection, respectively (Supplementary Fig. 15b, c). In addition, the mice infected with the atpD mutant showed improved survival compared to the mice infected with wild-type USA300 (Supplementary Fig. 15d), implying that an atp locus could serve as an effective therapeutic target for the treatment of bacterial infection. All these results were obtained with no apparent growth defects in the mutants (Supplementary Fig. 15e). When we compared the genes found to be important in the lungs or liver with those involved in the intracellular and extracellular milieus, we found that the set of genes identified as essential for survival in these organs resembled those required for extracellular survival (Fig. 6d) and as analyzed by the clustering analysis (Fig. 6e). Genomic profiling using the in vivo sepsis model is a conglomeration of results from the blood, tissue, and intracellular bacteria. Therefore, the results from bacteria recovered from organs might be skewed by the bacteria remaining in the extracellular and tissue environments.
All three systems, intracellular, extracellular, and intra-organ, required sets of genes involved in ATP production and maintenance of nutrient and ion balance, resulting in 27 core genes (Fig. 6f). These results indicate that ATP production and nutrient/ion balance are essential for growth in any given environment, despite other differences in each host niche.
