


ETC mutant strains
As described in Bever et al. (2022), C. elegans strains containing missense mutations in ETC genes listed in Table 1 were utilized for all experiments. Both the nuclear-encoded (gas-1 and isp-1) and mitochondrial-encoded (ctb-1 and cox-1) ETC mutant alleles are single base pair substitutions that were integrated onto the N2 nuclear background via 10 rounds of backcrossing of ctb-1 or cox-1 hermaphrodites with N2 males. The ctb-1(qm189) mutant was obtained from the Caenorhabditis Genetics Center (CGC; University of Minnesota); the cox-1 mutant was kindly provided by Dr. Marni Falk (Children’s Hospital of Philadelphia). Finally, we utilized a previously characterized isp-1(qm150) IV; ctb-1(189)M double mutant, also obtained from the CGC and integrated onto our N2 wildtype nuclear strain background. Following standard C. elegans nomenclature, IV refers to the nuclear chromosome number and M refers to the mitochondrial genome in the double mutant name. The mutant strains exhibited deleterious phenotypes as detailed in Bever et al. (2022) and below.
The nuclear-encoded gas-1 gene, so named for its general anaesthetic hyper-sensitive response, is located on the X chromosome and encodes GAS-1, a core 51 kDa protein subunit (orthologue of NDUFS2 in human and mouse and the bovine 49 kDa subunit) of mitochondrial ETC complex I that is required for oxidative phosphorylation (Kayser et al. 1999). Mutations of this gene, including the fc21 allele used here, are associated with severe phenotypic consequences including reduced progeny production, reduced complex I-dependent metabolism, hypersensitivity to oxidative stress owing to increased ROS production, and low ATP levels relative to wildtype (reviewed in Van der Bliek et al. 2017).
The nuclear isp-1 gene encodes the Rieske iron sulfur protein of ETC complex III (cytochrome bc1 complex), which transfers electrons from ubiquinol to cytochrome c and, like complex I, simultaneously pumps protons across the mitochondrial inner membrane thereby helping to establish the proton gradient. The isp-1(qm150) and other mutations have been characterized by slowed metabolism and extended lifespan (Rea 2005; Ventura et al. 2006). The slow-living phenotype of isp-1 appears to result from an increased reliance upon alternate, and less efficient, metabolic pathways for energy production and a concomitant reduction in mitochondrial respiration (Rea 2005; Jafari et al. 2015).
In addition to isp-1(qm150), we recreated a previously characterized isp-1 IV; ctb-1 M double missense mutant (Feng et al. 2001). The mutant screen of Feng et al. (2001) identified isp-1(qm150) and also yielded an isp-1(qm150) IV; ctb-1(189) M double mutant. For this study, we first isolated the nuclear isp-1 mutant allele onto our laboratory wildtype N2 strain via 10 rounds of backcrossing; males were then mated to hermaphrodites of the mitochondrial ctb-1 mutant strain prior to use in the current experiments. ISP-1 and the mtDNA-encoded cytochrome b, CTB-1, physically interact within ETC complex III. This isp-1 mutation replaces a conserved proline with a serine in the head domain of ISP-1, which functions to transfer reducing equivalents within complex III to cytochrome c1 through a series of conformational changes (Iwata et al. 1998). Homology modeling indicates that this mutation distorts the structure and alters the redox potential of ISP-1 (Feng et al. 2001; Jafari et al. 2015). ctb-1(qm189) is a homoplasmic (fixed within and across individuals in a population) allele that substitutes a valine for a conserved alanine in CTB-1 near the binding site of the ISP head domain (Feng et al. 2001). The isp-1 and ctb-1 mutant locations are not predicted to directly interact (Iwata et al. 1998). However, ctb-1(qm189) partially suppresses the isp-1(qm150) phenotype via beneficial allosteric effects on complex I (Suthammarak et al. 2009) This finding makes sense in light of the fact that ETC complexes I, III and IV form stable supercomplexes that improve ETC functionality (Acín-Pérez et al. 2008). isp-1(qm150) weakens the association of this supercomplex and reduces the amount and activity of complex I. The ctb-1(qm189) mutation exhibits sign epistasis (Weinreich et al. 2005) as it is beneficial within the context of isp-1(qm150), but by itself causes slightly deleterious effects on fitness and complex III activity (Suthammarak et al. 2009).
The cox-1 gene encodes cytochrome c oxidase I (COX-1), the main catalytic subunit of cytochrome c oxidase of ETC complex IV. The three mtDNA-encoded subunits (COX-I, II, III) form the functional core of the complexes; the nDNA-encoded subunits are essential for complex assembly and function (Barrientos et al. 2002; Li et al. 2006). Many additional nDNA genes are essential for biogenesis of the functional complexes (Barrientos et al. 2002), and reduce oxygen to water. It is not believed to be a major contributor to ROS production. However, its structural/functional state may indirectly affect ROS generation via other members of the I:III:IV supercomplex (Greggio et al. 2017). Cytochrome c oxidase deficiency is a leading cause of human mitochondrial disorders (Shoubridge 2001), and interpopulation (Rawson and Burton 2002) and interspecies (Sackton et al. 2003) hybrid incompatibilities are documented to result from breakup of coadapted gene complexes involving this enzyme. We used a cox-1 mutation isolated from a wild C. elegans strain, CB4856 (Hawaii) (Dingley et al. 2014). The mtDNA of this strain differs from that of the laboratory wildtype N2 by a substitution that replaces an alanine with a serine in the N-terminus of COX-1 within the matrix side of the complex IV catalytic core. Interestingly, the variant was found to be beneficial (i.e., cause increased mitochondrial membrane potential) to CB4856 worms cultured at their native temperature of 25 °C, but exerted a variety of deleterious effects at the standard laboratory temperature of 20 °C (i.e., reduced lifespan, elevated mitochondrial matrix oxidant burden, and oxidative stress). A transmitochondrial cybrid strain containing a CB4856 mtDNA genome (homoplasmic for the cox-1 variant) on a N2 nDNA background exhibited similar deleterious phenotypes at 20 °C (Dingley et al. 2014). Later studies including that by Zhu et al. (2019) found that CB4856 mitochondria were also associated with reduced fecundity in the presence of an N2 nuclear background.
Manipulating the mating system
Toward understanding the impact of mating system on mitonuclear evolutionary rates and patterns, strains containing mutations in ETC genes listed in Table 1 were generated on Katju laboratory wild-type N2 (facultatively outcrossing), and on xol-1 (selfing) and fog-2 (outcrossing) deletion-mutant genetic backgrounds. The xol-1 and fog-2 deletion alleles were generated via CRISPR-Cas9 editing (NemaMetrix/InVivo Biosystems, Eugene, OR). XOL-1 is the master sex-determination switch that functions in X-chromosome dosage compensation; disruption of this function in xol-1 mutants causes male (XO) lethality and results in obligate selfing (Miller et al. 1988). FOG-2 is an F-box protein that helps to initiate sperm production in hermaphrodites; fog-2 mutant populations consist of equal proportions of feminized hermaphrodites and males that reproduce via obligate outcrossing (Clifford et al. 2000).
Culture conditions
Each ETC ancestral mutant strain on each of the three genetic backgrounds (henceforth referred to as “G0” for generation 0) was divided into either 24 replicates (for gas-1) or eight replicates (all other strains) and subjected to laboratory evolution as described in Wernick et al. (2019) and Bever et al. (2022), respectively, wherein replicate “recovery lines” (RC lines; cf., Estes and Lynch 2003) were maintained under standard laboratory conditions but in large population sizes (i.e., bottleneck sizes of 1000) for at least 60 generations, resulting in sets of “G60 RC lines”. Eight replicates each of the N2, fog-2, and xol-1 control strains underwent the same treatment. Populations were maintained at 20 °C on 100 mm Petri plates containing Nematode Growth Medium Light (NGML), 1 ml of 200 mg/ml streptomycin, and streptomycin-resistant OP50-1 Escherichia coli as a food source. For each RC line, standardized bleach treatment was used to maintain evolving populations in non-overlapping generations. Each generation, worms were rinsed from crowded plates using M9 buffer into 15 ml conical tubes. Conical tubes were centrifuged at 800 rpm for 30 s and excess M9 poured off. A mixture of three parts diluted commercial bleach (final concentration = 2.75% bleach in di H2O) and one part 5 M NaOH was then added to the conical tubes. Tubes were inverted every 2 mins until the worms were dissolved, releasing viable embryos. Once dissolved, the conical tubes were centrifuged again until an embryo pellet formed. The bleach, NaOH and M9 were poured off and fresh M9 added to rinse the embryo pellet. This rinse process was repeated three times. The embryo pellet was then transferred to a 1 ml microtube and vortexed, after which 1 ul was transferred onto an eight-well slide. Embryo counts were used to calculate the amount needed to transfer 1000 individuals onto new large plates to initiate the next generation. Strains were transferred when the majority of hermaphrodites or females reached peak gravidity and began laying embryos with a few hatched larvae; plates were typically well-starved by this point. The time in days between transfers was tracked for all lines across the experiment.
Fitness assays
Following standard protocols, we assayed fitness-related traits for all lines alongside the wildtype N2 control and the appropriate ancestral mutant. For all facultatively outcrossing (N2 background) and obligately selfing (xol-1 background) lines, we assayed daily production of selfed progeny following established methods (e.g., Wernick et al. 2019). These assays were initiated by allowing 10–15 adult hermaphrodites from a line to lay embryos for 5 h. Single embryos were then transferred to individual 60 mm Petri plates containing NGML, 1 ml of streptomycin, and OP50-1 E. coli food source, and allowed to develop. Once hatched, the number of plates was reduced to 20 for the N2 control, 10 for each ancestral mutant, and five for all G60 RC lines. At the same time each day, hermaphrodite parents were transferred to a fresh plate. Offspring were allowed to develop to the L3/L4 larval stage and then killed with a drop of 0.5 M sodium azide and stored at −4 °C to be counted. Offspring were counted by counterstaining plates with toluidine blue dye.
Outcrossed progeny production was assayed for the obligately outcrossing fog-2 lines. These assays were initiated by picking individual L4 larval stage male and female pairs onto fresh plates–20 pairs for the ancestral mutant and 10 pairs for all G60 RC lines. The focal pairs were transferred together every 24 h and offspring were counted as described above.
Offspring counts from both selfed- and outcrossed-fitness assays were used to generate reproductive schedules and calculate total reproductive output and relative fitness of the mutants compared with N2, and with the relevant G0 strain following Christy et al. (2017). Relative fitness of each individual was computed as: ω = Σe -rx l(x)m(x), where l(x) is the number of worms surviving to day x, m(x) is the productivity (number of surviving progeny) at day x, and r is the mean intrinsic population growth rate of the assay-specific N2 or ancestral mutant G0 control as appropriate. The latter was calculated by solving Euler’s equation for r from ω = Σe -rx l(x) m(x) = 1 using an average value of l(x) m(x) for each block-specific control. We used x = 4.75 on the first reproductive day (cf., Vassilieva et al. 2000).
Male frequency
Male frequency counts were conducted for fog-2 and xol-1 control strains, and for each RC line at G5, G10 and every ten generations up to 60 exactly as described in Bever et al. (2022). The number of males and hermaphrodites (or females for fog-2 lineages) on each plate were counted to calculate an average ratio of males for each RC line.
L1 larvae tissue collection and genomic DNA extraction for mtDNA copy number estimation
A total of 144 C. elegans lines were assayed for mtDNA copy number (mtDNA-CN henceforth) including 128 G60 RC lines and 16 G0 ancestral controls. All lines were retrieved by thawing cryopreserved stocks and establishing populations comprising 25–75 live worms on 30 mm NGM plates seeded with a lawn of E. coli OP50 and incubated at 20 °C. For each line, nematode populations were allowed to grow for an additional two to three generations and then collected with M9 solution and transferred to two large 90 mm NGM plates seeded with E. coli OP50 to enable further population expansion.
The number of mitochondrial genome copies and mtDNA genomes per cell shows substantial variation depending on the developmental stage of C. elegans, with ~25,000 copies (40–45 copies per cell) through the first three larval stages, L1 to L3 (Lemire 2005). This is followed by a five-fold increase in mtDNA-CN at the fourth larval stage (L4) and another six-fold increase in adult hermaphrodites (Lemire 2005). Furthermore, it remains to be determined if adult C. elegans males vary in mtDNA-CN relative to hermaphrodites. Hence, to generate standardized mtDNA-CN measurements without the influence of developmental stage or sex of the adult, we probed mtDNA for all evolved and ancestral nematodes lines at the first larval (L1) developmental stage. To prepare synchronous populations of L1 worms, the expanded worm populations on large NGM/OP50 plates with abundant gravid hermaphrodites or females were bleached using standard protocols (Brenner 1974). The resultant egg pellet was transferred to an unseeded NGM plate and incubated overnight. Synchronized L1 larvae emerging from the hatched eggs were collected in 0.5 ml TEN solution and the L1 tissue was frozen at −20 °C for subsequent DNA extraction. Genomic DNA (gDNA) for each line was isolated from the frozen L1 tissue using the PureGene Genomic DNA Tissue Kit (Qiagen no. 158622) as per a previously described protocol (Konrad et al. 2017) followed by DNA quantification using a Thermo Fisher Nanodrop spectrophotometer.
Quantification of mtDNA-CN using digital PCR (dPCR)
Primers and probes for dPCR were designed using the PrimerQuest™ Tool (Integrated DNA Technologies) and targeted the mitochondrial gene cox-1 and a single-copy nuclear gene, daf-3, on the X chromosome.
Primer-probes for mtDNA gene cox-1:
Forward Primer: 5′− GTT GTG GGA CTA GGT GAA CAG −3′
Reverse Primer: 5′− ACC CTG CTG CAT GTA AAC TAA −3′
Probe: 5′− /56-FAM/AA ATC TAC TCT ACT TCC AGG GTG CCC /3BHQ_1/ −3′
Primer-probes for nuclear gene daf-3:
Forward Primer: 5′− GAA ATC GAT TAT CGT TGA ACT TGG T −3′
Reverse Primer: 5′− CAG GTT CTG GAG ATC ATT CTT CTT A −3′
Probe: 5′− /5HEX/AA AGC TTG CGA GTC CCT GGT GAA A/3BHQ_1/ −3′
The average mtDNA-CN for each nematode line at the L1 larval stage was measured using the QIAcuity Digital PCR (dPCR) System, Nanoplate 26 K 24-well plates (Qiagen) and QIAcuity Probe PCR Kit (Qiagen, catalog # 250102). Each 40 μl dPCR reaction mix comprised 4 μl gDNA template (0.05 ng/μl), 10 μl Probe PCR Master Mix (4X), 4 μl custom dPCR copy number assay with a FAM fluorophore targeting the mitochondrial gene cox-1 (4 μM), 4 μl custom dPCR copy number assay with a HEX fluorophore targeting the nuclear gene daf-3 (4 μM), and 18 μl molecular-grade water. Digital PCR assays for each line were performed in duplicate using the following profile: 2 min at 95 °C, followed by 35 cycles of 15 s at 95 °C and 30 s at 60 °C. The QIAcuity Software Suite 2.1 was used to analyze the dPCR results and generate mtDNA-CN per sample. This approach provides a measurement of the relative mtDNA copy number normalized by line-specific nuclear DNA content or in other words, the average number of mtDNA copies per haploid nuclear genome per cell at the L1 stage.
Statistical analysis
Figures 1–3 and Supplementary Fig. S2 were created with R v. 4.4.1 (R Core Team 2024) utilizing RStudio IDE v. 2024.4.2.764 (Posit team 2024), and the packages ggplot2 (Wickham et al. 2007), ggbreak (Xu et al. 2021), gridExtra (Auguie and Antonov 2017) and cowplot (Wilke 2024). We first assessed whether fitness of the N2 control differed across assay blocks, and whether control strains (N2, xol-1, and fog-2) differed from one another using a one-way ANOVA. We then assessed whether these control strains exhibited any fitness changes across 60 generations of evolution by testing the model: ω relative to N2 = μ + generation + line + ε for each strain separately, and with generation (G0 ancestor versus G60 RC) as a fixed effect and line as a random effect using JMP Pro v. 18 (JMP Statistical Discovery LLC 2025).
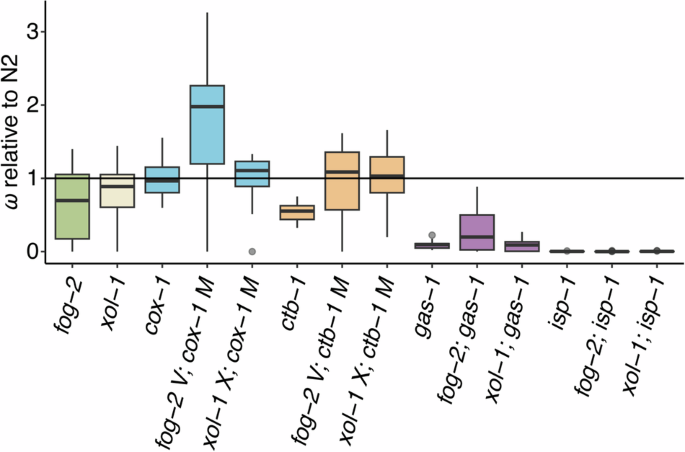
Box plots of fitness data for the ancestral (G0) fog-2 and xol-1 control strains and the G0 ETC mutants relative to wildtype N2. Fitness is a composite measure of average daily survival and offspring production, taking into account the mean intrinsic population growth rate of the assay-specific N2 control. Each plot represents an average of 5–20 independently measured replicates. Boxes encompass the upper and lower quartiles of the data with the central line denoting the median, and upper and lower whiskers denoting the maximum and minimum excluding outliers, respectively. Single points denote statistical outliers. The horizontal line at 1.0 represents wildtype N2 fitness. From left, data for the obligately outcrossing fog-2 (green) and obligately selfing xol-1 (cream) G0 ancestral controls are shown. These are followed by groups of G0 ancestral mutants organized by ETC mutant type (left to right): the mitochondrial-encoded cox-1 (blue) and ctb-1 (orange), and the nuclear-encoded gas-1 (purple) and isp-1 (not visible). Each group encompasses three mating systems (left to right): facultatively outcrossing, obligately outcrossing (“fog-2”) and obligately selfing (“xol-1”).
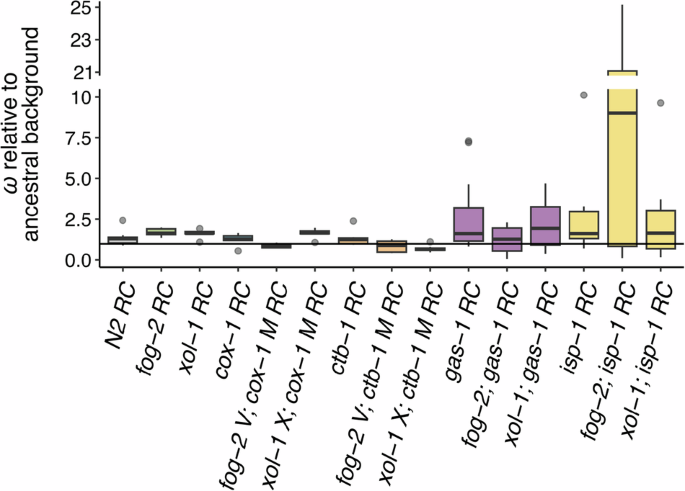
Box plots of fitness data for G60 RC lines relative to that of their respective G0 ancestors. Fitness is a composite measure of average daily survival and offspring production, taking into account the mean intrinsic population growth rate of the relevant assay-specific G0 control. Each plot was created using average relative fitnesses from eight independently evolving replicate lines (each with n = 5–20 technical replicates). The horizontal line at 1.0 represents a strain’s G0 ancestral fitness. Note the broken y-axis and change in scale relative to Fig. 1. RC lines are grouped by ETC mutant type as in Fig. 1 with the addition of the N2 RC lines. From left, data for the facultatively outcrossing N2, obligately outcrossing fog-2, and obligately selfing xol-1 G60 evolved controls are shown. These are followed by groups of G60 RC lines organized by ETC mutant type (left to right): the mitochondrial-encoded cox-1 (blue, although not visible) and ctb-1 (orange), and the nuclear-encoded gas-1 (purple) and isp-1 (yellow). Each group encompasses three mating systems (left to right): facultatively outcrossing, obligately outcrossing (“fog-2”) and obligately selfing (“xol-1”).
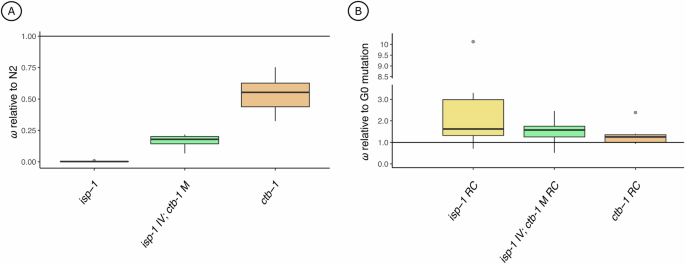
A Box plots of fitness data for G0 isp-1 (yellow) and ctb-1 (orange) single mutants and the isp-1 IV; ctb-1 M double mutant (green) relative to N2 (same data as in Fig. 1). B A box plot of G60 isp-1 and ctb-1 single mutant RC lines and isp-1 IV; ctb-1 M double mutant RC lines relative to their respective G0 ancestral background (same data as in Fig. 2). Note the broken y-axis and change in scale relative to (A). Each plot was created using average relative fitnesses from eight independently evolving replicate lines. Single points denote statistical outliers. All data in panels A and B are from animals experiencing the wildtype facultatively outcrossing mating system.
Because distributions of relative fitness tended to be right-skewed (owing to scores of 0) for the ETC mutants, these data were square-root transformed prior to analysis. The transformation did not achieve normality for all strains, but did improve model fits. First, to examine differences in fitness among the ancestral ETC mutant strains, a two-factor ANOVA testing the model: ω relative to N2 = μ + ETC background + mating system + (ETC background x mating system) + ε, where ETC background (cox-1, ctb-1, gas-1, or isp-1) and mating system (N2, fog-2, or xol-1, corresponding to wildtype facultatively outcrossing, outcrossing, and selfing) are fixed effects.
Second, to further investigate the impact of ETC mutation type and mating system on fitness evolution of mutant strains, we evaluated the model: ω relative to the appropriate G0 background = μ + ETC mutation + mating system + generation + their full-factorial interactions + line(ETC mutant) + ε, where generation (G0 ancestor versus G60 RC) is a fixed effects and line(strain) is a random effect, using restricted maximum likelihood (REML) with the mixed procedure of JMP Pro v. 18.0 (JMP Statistical Discovery LLC 2025). These analyses excluded control strains (both G0 and G60 N2, xol-1 and fog-2). We also performed select one-way ANOVAs to test the effects of ETC background or RC line on G60 fitness data separately, followed by Tukey’s HSD comparisons.
Third, we tested the model: y = μ + ETC mutation + generation + (ETC mutation × generation) + line(ETC mutant) + ε for two traits (ω relative to the appropriate G0 background and early productivity) to explore the impacts of these factors on evolution of the nDNA/mtDNA double mutant, isp-1 IV; ctb-1 M, and its two corresponding single mutants using the same procedure as above.
To determine whether the evolution of high male frequency within strains may have contributed to fitness evolution as suggested to be the case with the gas-1 RC lines (Wernick et al. 2019), we calculated Spearman’s rank correlation coefficients to evaluate relationships between RC-line specific mean relative fitness measures and their G60 male frequency for the other facultatively outcrossing strains. These included the G60 N2 RC lines and those of cox-1, ctb-1, isp-1 mutants, and the isp-1 IV; ctb-1 M double mutant.
The distribution of mtDNA-CN data was fairly normally distributed excepting a small group of high mtDNA-CN outliers. As no transformation could achieve normality, we performed Van der Waerden tests followed by non-parametric Steel-Dwass comparisons of mtDNA-CN to assess differences among various groups of lines.
Finally, we used a MANOVA to evaluate the influence of a strain’s ETC mutant background, mating system, and their interaction on the bivariate relationship between fitness and mtDNA-CN. Both traits were measured relative to the appropriate G0 ancestor. Raw data were used for this analysis and we employed the Pillai’s Trace test statistic which is robust to violations of assumptions including, in our case, homogeneity of variance-covariance matrices across strains.
